

Introduction
Microscopic traffic simulation model
1. Model framework
2. Car-following model
Microscopic simulator
1. Problem statement
2. Freeway traffic characteristics: safety and efficiency
Conclusions
Introduction
Microscopic simulation in transportation field is a powerful and efficient tool for describing traffic phenomena aggregated from human drivers’ behavior in real roadways. Simulations are helpful in solving traffic problems by traffic control and management, as well as to establish both short and long-term policy. Recently, the need for the traffic simulations at the detailed level of vehicle agent has been increasing with the introduction of new technologies (e.g. V2X communication system and autonomous vehicles). Consequently, a development of a systematic simulation model that includes individual driving behavior and interactions between vehicles is essential to unveil the detailed mechanisms of individual driving behaviors-traffic phenomena.
In the past, typical formulations on the traffic stream in simulations have been conducted using fluid mechanics at macroscopic scale, where a vehicle is regarded as a particle in continuum fluid (Lighthill et al., 1955). One of the well-known and widely-used traffic simulation models is Cell Transmission Model (CTM) proposed by Daganzo(1994). CTM employs a numerical method to solve kinematic wave equation based on the Godunov’s scheme. However, abovementioned models apply only the concept of continuum mechanics and do not consider the interaction between the vehicles. Eventually, with the growing awareness on agent modeling, many studies have been conducted with a focus on individual driver’s action to depict the car-following behaviors.
First researches on the car-following model dates back to the 1950’s (Reuschel, 1950). Pipes(1953) assumed that the follower keeps a safety time headway from the leading vehicle. Later, Stimulus response model framework was proposed by GM research group (Chandler et al., 1958), where the response (in terms of acceleration) is generated from the lagged input of stimulus (in terms of relative speed between two vehicles).
Likewise, numerous car-following models focusing on the safety distance between following and leader vehicles were developed. One of the most famous and generally well-known model is introduced by Gipps(1981). Gipps’ model assumed that breaking maneuvers are always executed with a constant deceleration, which suggests that there is no distinction between the comfortable and maximum deceleration, where the distance gap to the leading vehicle should not become smaller than the minimum safety gap. The speed of the following vehicle is decided based on the acceleration term, constant speed term, and safety distance term.
In 2002, Newell(2002) modeled a car-following behavior with a linear relationship between speed and spacing in congested traffic. This model described that in congested condition, the following vehicle changes its speed after the driver’s reaction time at the point when the leader vehicle changes its speed in the time-space plane. Yeo et al.(2008) took this assumption from Newell’s model and combined it with safety condition in Gipps’ model to depict driver’s behavior under both congested and uncongested conditions. They proposed an overall framework of microscopic traffic simulation called as “Oversaturated Freeway Flow Algorithm”. Also, they adopted “Short-Gap Mode” that driver’s parameters are systematically changed in acceleration and deceleration to describe driver’s asymmetric characteristics introduced by the other studies Newell(1962), Foote et al.(1963), Edie(1965), Treiterer and Myers(1974), Yeo and Skabardonis(2009).
As microscopic traffic models focus on individual movements of vehicles, these models not only contain car-following model which is a longitudinal movement model but also lane-changing model, which describes lateral movement of an individual vehicle. Then, rule-based (Gipps, 1986, Hidas, 2002) and stochastic-choice (Ahmed, 1999) based lane-changing model were proposed. Recently, some studies tried to model and formulate the actual decision making process of lane-changing. For example, MOBIL (Kesting et al., 2007) used acceleration as an incentive factor to minimize overall deceleration rate in lane changing. MOBIL also contains parameters such as politeness factor and acceleration thresholds to describe the individual characteristics of drivers.
Accordingly, there have been many efforts to describe the traffic flow dynamics and individual driver’s movement throughout the history of transportation engineering. However, the accurate descriptions on individual driving behaviors with a cogitation of not only various traffic situations on real roadways but also of geometric conditions are still remaining as an important task. Moreover, its robustness and applicability for a real-time traffic simulation becomes inevitable to improve the reactive and proactive traffic control and management on roadway networks so far.
To remedy the weaknesses of the previous models, this study aims to improve the microscopic simulation framework introducing an asymmetric driving characteristic on the speed-spacing relation. We also provide a simulation practice study of the developed model for an analysis of traffic safety and efficiency at uphill sections in expressway. The rest of the paper is structured as follows: 1) a proposal of new approach on microscopic simulation model and its verification by using a real trajectory data and 2) an application of the proposed traffic simulator to analyze the traffic characteristics at uphill sections in Korean expressway. Finally, summary of the study and future works are presented in the conclusion.
Microscopic traffic simulation model
Microscopic traffic simulation model has an advantage on describing detailed behaviors of individual vehicles, including interaction between the other vehicles. Accordingly, it is possible to clearly identify the mechanism behind the various traffic phenomena (e.g. stop-and-go traffic). However, modeling each individual vehicle behavior in simulation demands a great deal of time and energy. Microscopic traffic simulation must accurately describe the driving patterns of real drivers, as well as provide fast computing ability and compatibility environment with robust framework that allows simultaneous sectional simulation of large networks.
1. Model framework
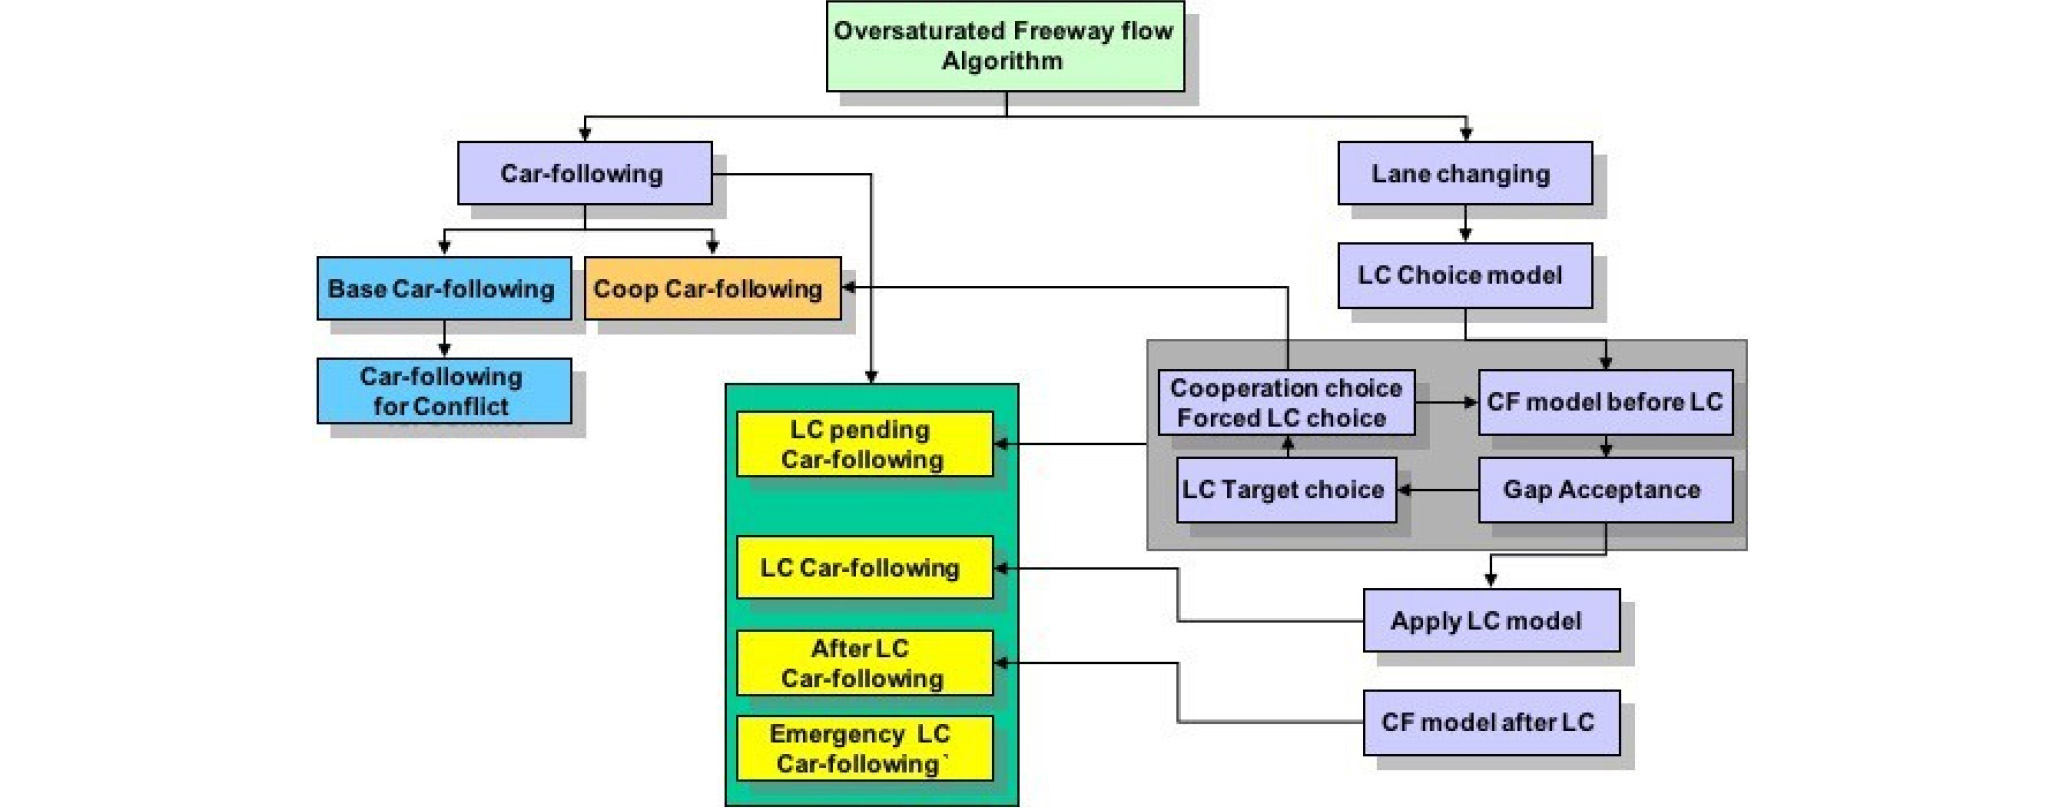
This study uses the model framework proposed in the previous study by Yeo(2008). The model depicts not only car-following behavior but also lateral movements of vehicles (i.e. lane-changing maneuvers). Yeo’s model is currently considered as one of the most effective models among the microscopic simulation models as illustrated in Figure 1. Various driving modes on a freeway are defined based on the linear relationship between speed and spacing. For example, basic car-following mode is on when the driver drives on a freeway following a leader vehicle. When there is an intervention from another vehicle in the adjoining lane, driver’s mode changes to “cooperation”. Such continuous driving mode changes can be explicitly formulated.
2. Car-following model
According to the OFFA (Yeo et al., 2008), the basic rule in both car-following and lane-changing modes is linear on vehicle’s speed and its spacing (Newell, 2002). This is consistent with Daganzo’s macroscopic traffic flow theory (Daganzo, 2006), which describes well the traffic flow under actual traffic congestion. The base car-following function is expressed as following:
(1)
where, xn: Location of n-th vehicle (i.e. following vehicle) at time t
xn-1: Location of (n-1)-th vehicle (i.e. leading vehicle) at time t
Δt: Simulation time step
snjam: Jam spacing of the follower (including vehicle length of the leader)
However, this base car-following function cannot describe the whole life-cycle of stop-and-go traffic and it shows an asynchronous computation in simulation time. In detail, the base car following function denotes that stop-and-go traffic does not disappear. Due to the linear assumption, the stop-and-go wave does not dissipate in congested traffic once it is formed as the vehicle’s trajectories are parallel. Also, this function cannot describe the asymmetric driving behavior which is a dominant pattern of the driver under congested traffic (Yeo et al., 2009). On the other hand, the asynchronous information is used to calculate the position of the following vehicle. The left side of the Equation 1 represents the next time step position of the following vehicle, which is expressed as a function of the leader’s position in the previous simulation time step by the follower’s reaction time. This means that a temporary memory is required to store information of previous simulation time steps, which represents a major weakness to large-scale transportation network simulation.
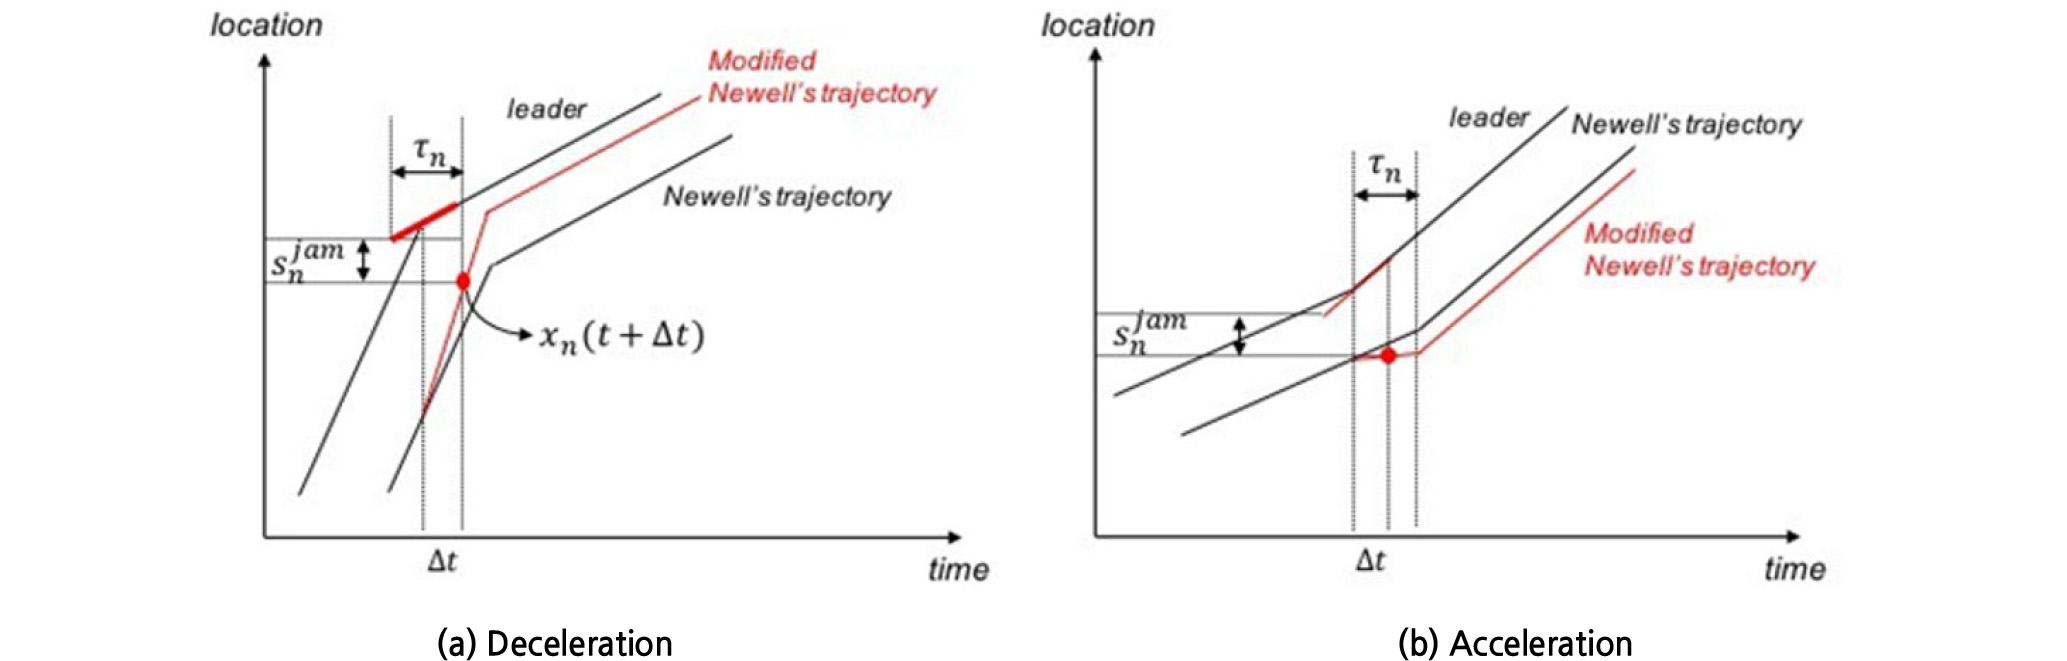
To remedy the abovementioned flaws, the base car-following function is modified to synchronize by approximating the leader’s position at time (t+Δt-τn) as following:
(2)
(3)
This approximation still satisfies Equation 1 in the following condition:
(4)
In other words, this approximation holds for Equation 4 in only free-flowing condition. In congested traffics, this approximation can improve the existing models’ limitations in describing asymmetric driving behavior. Figure 2 hypothetically illustrates a car-following trajectory pair in both deceleration and acceleration conditions under congested traffic. Without handling of driver’s attributes by driving state (i.e. acceleration or deceleration), the approximation still satisfies the base car-following function in free-flowing condition and clearly depicts the driver’s asymmetric characteristics. Above all, the approximation enables synchronized formulation and thereby prevents unnecessary memory usage in computation. In details, the memory to determine a vehicle’s position at the next time step, t+Δt, only requires as much as the amount of storage to keep positions and speeds of vehicles who are driving ahead, at t+Δt.
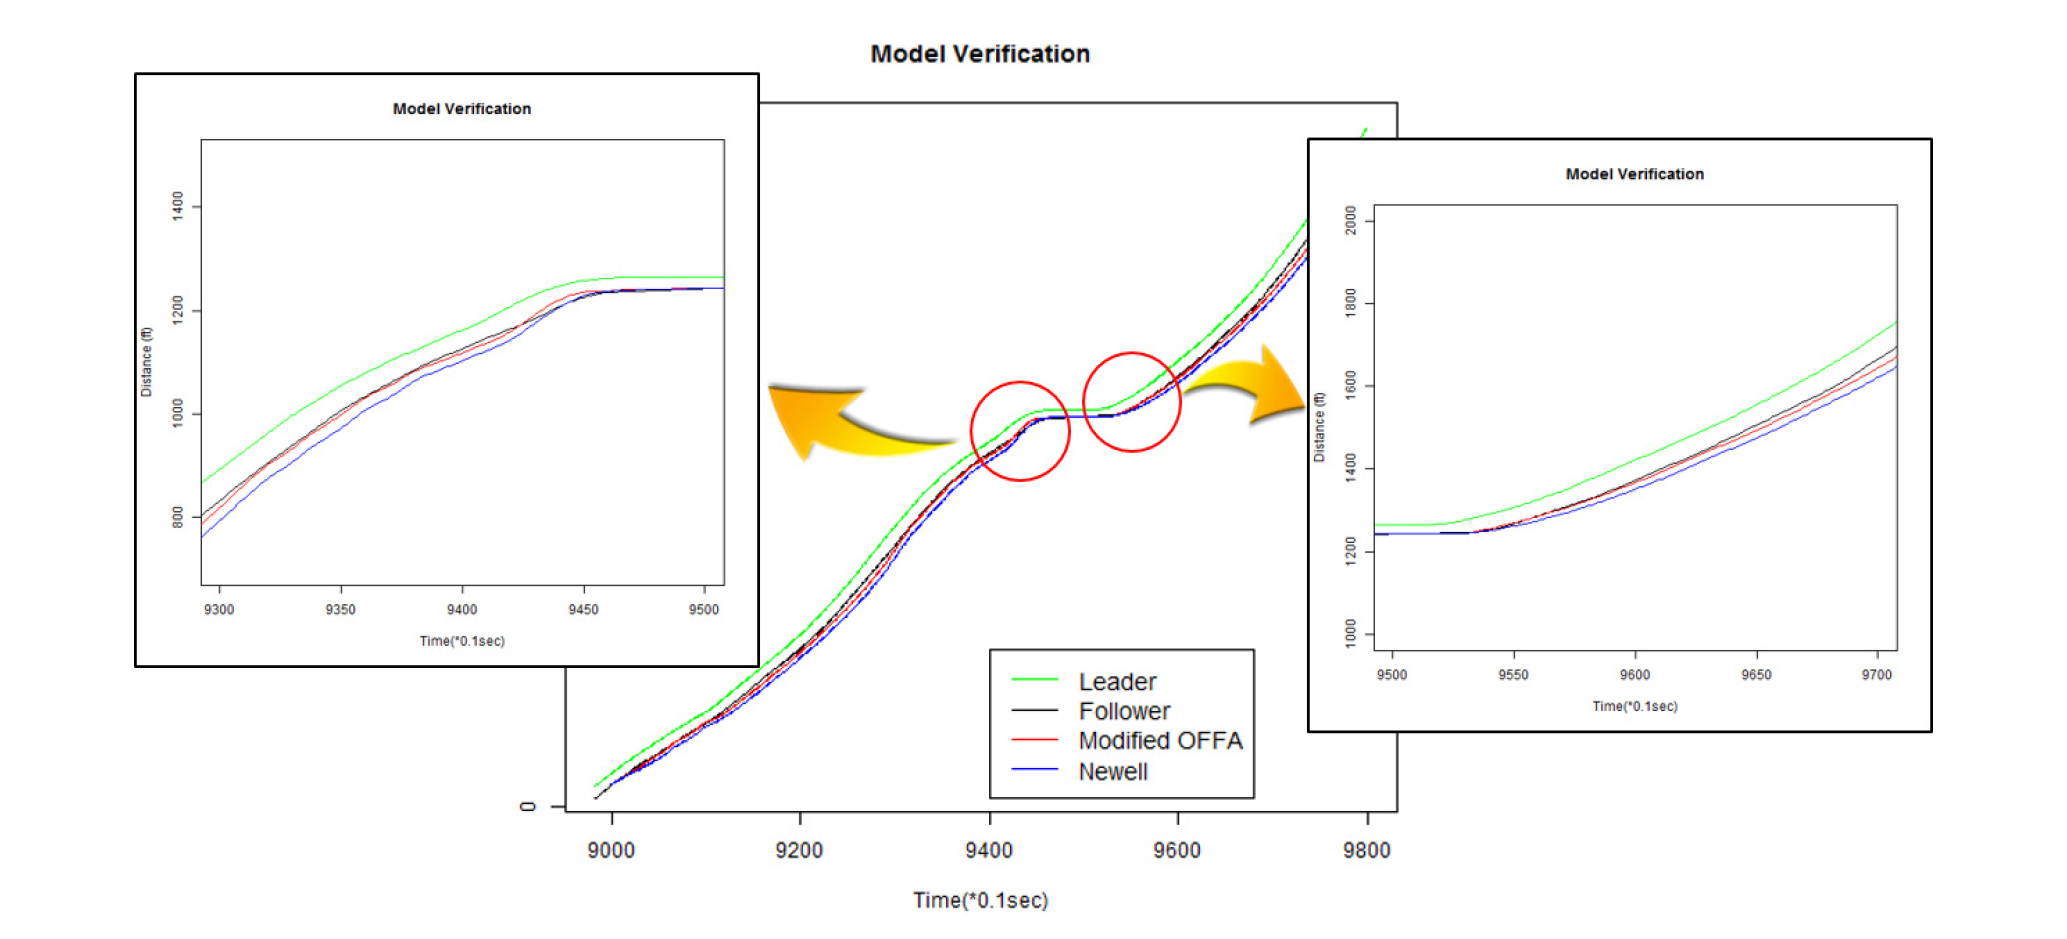
The proposed car-following model is first implemented in a spreadsheet and verified to investigate whether it shows a decent description of the following vehicle trajectory. Figure 3 shows an example of a real trajectory pair compared to the simulated trajectories derived from Equations 1 and 3 respectively. Validation process is omitted in this paper as the previous study has already verified the proposed algorithm using the NGSIM dataset and loop detector data of I-80 site (Yeo et al., 2008).
Microscopic simulator
In this section, an application of the simulation algorithm suggested in the previous section is presented: freeway traffic characteristics at uphill section according to the type of auxiliary lane is studied. The analysis is conducted on both efficiency and safety which are estimated based on travel time delay and individual safety surrogate measure at uphill section, respectively.
1. Problem statement
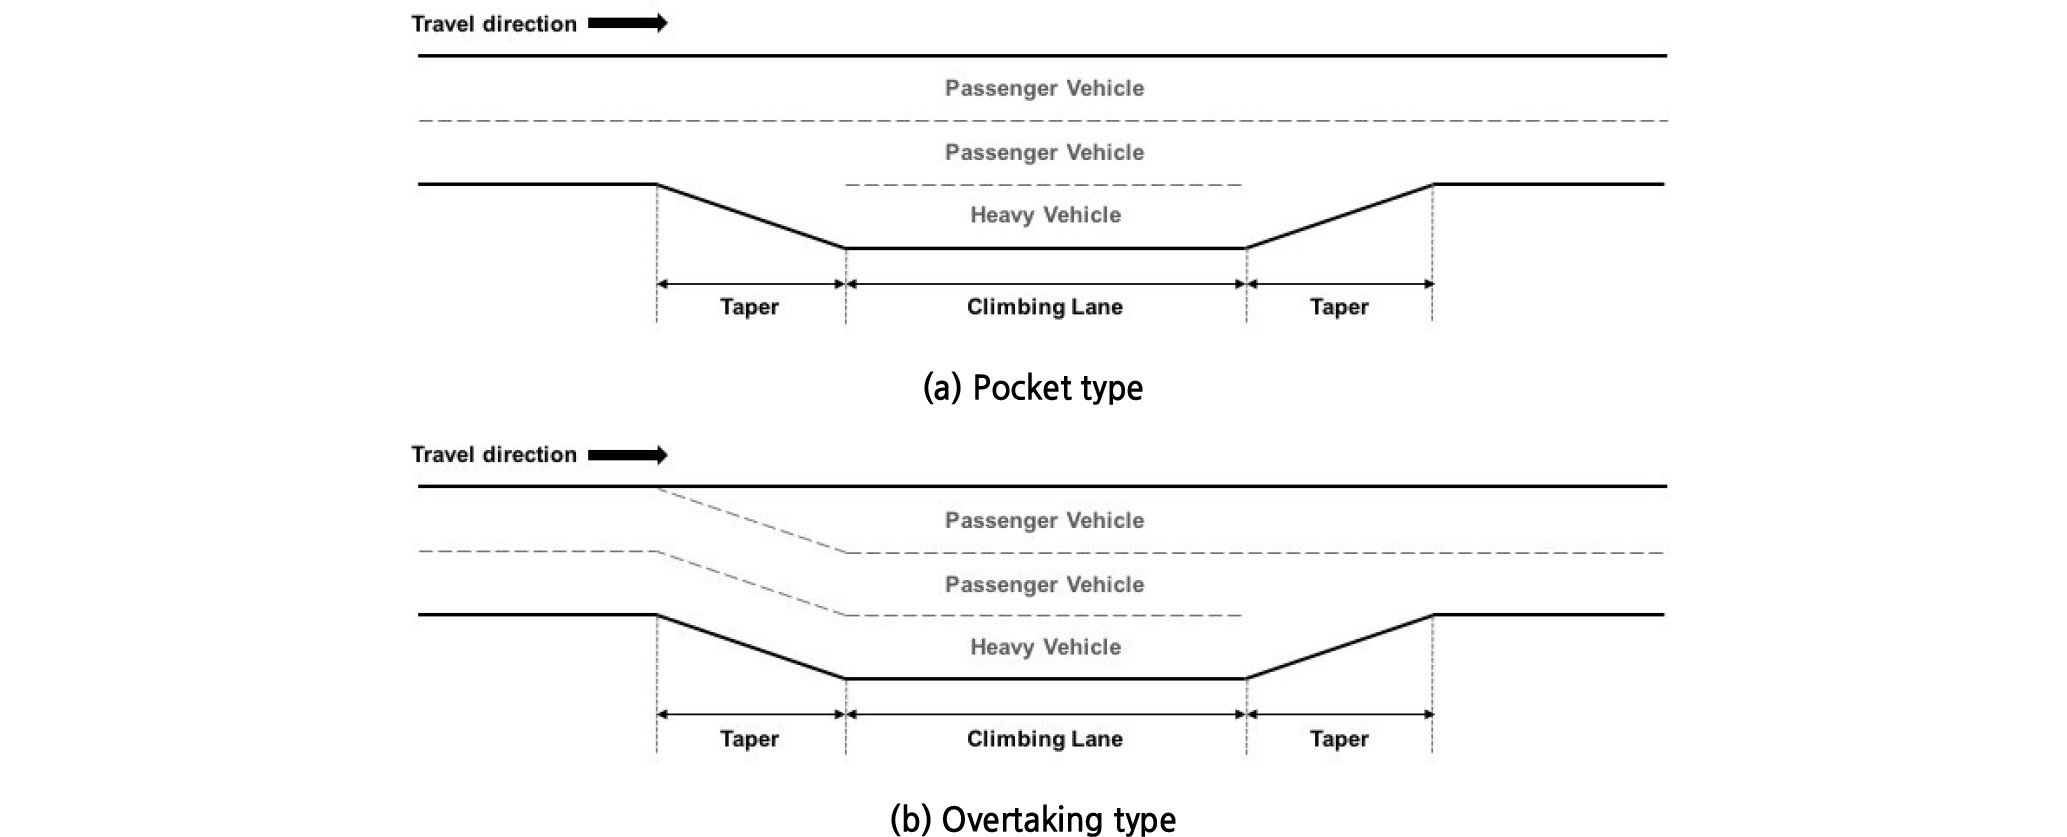
An expressway is designed for high-speed vehicular traffic. However, an expressway with an uphill segment usually results in a drop of traffic efficiency due to the heavy class vehicles with low-speed and acceleration. To solve this issue, installation of auxiliary lane (so-called climbing lane) is recommended in many countries (California Dept. of Transportation, 2012, European Commission, 2000, Japan Highway Public Corporation, 1990, Korea Ministry of Land, Transport and Maritime Affairs, 2012).
In Korea, pocket type climbing lane was first introduced at uphill sections. However, little effect was observed as the heavy class vehicles had reluctance to change the lane twice (at diverging and merging). Eventually, the auxiliary lane type changed to overtaking type due to the low compliance rate. Ironically, accident number has increased since the auxiliary lane type changed. Several studies were done on the conversion of lane type and the number of accident increase, but it was noted that there is little correlation between the lane type change and number of accidents (Shim et al., 2016).
Also, it requires cost and time to deploy a new type of climbing lane, and drivers who are traveling through the corresponding roadways should adapt themselves to the new facility that can cause an increase of traffic collisions. To remedy the limitations on deploying a type change of climbing lane in uphill segments, traffic simulation is a very useful tool to evaluate performances of both type of climbing lane. Especially, merging behavior is dominant in uphill segments thus modeling individual driving behavior is inevitable to conduct the evaluation. As revealed from the literature review, the existing models describing the car-following behavior has not fully addressed the merging behavior of individual drivers and interactions among them near the zippered point.
Therefore, the proposed model is used to conduct a comparison analysis. Operational efficiency and safety of freeway traffic are studied for the three cases: pocket type, overtaking type and non-operating cases (herein after, closed type). Traffic volume and heavy vehicle class ratio are modified to compare the results. Given these points, an optimal strategy is investigated to be used as a guideline for climbing lane operation at uphill segment.
Note that this study provides an overview of traffic performances of climbing lane by investigating the individual trajectory obtained from the simulation. There are about eighty uphill segments Korean expressway, and we thus cannot provide a specified solution for each segments because those show totally different geometric properties (e.g. curvature, grade and length of uphill segment) and traffic condition (e.g. the number of lanes, traffic volume, heavy vehicles class ratio).
2. Freeway traffic characteristics: safety and efficiency
Usually, the speed limit for the heavy class vehicles (e.g. bus and truck) is set lower than for the common vehicles (e.g. passenger vehicle and recreational vehicle) due to the severity of accidents. The speed limit for heavy class vehicles is 80 (or 90) kph in expressways whereas the speed limit for passenger vehicles is 100 (or 110) kph. Accordingly, truck class vehicles usually form a moving bottleneck at uphill section, lowering the operational performance and increasing the total travel time.
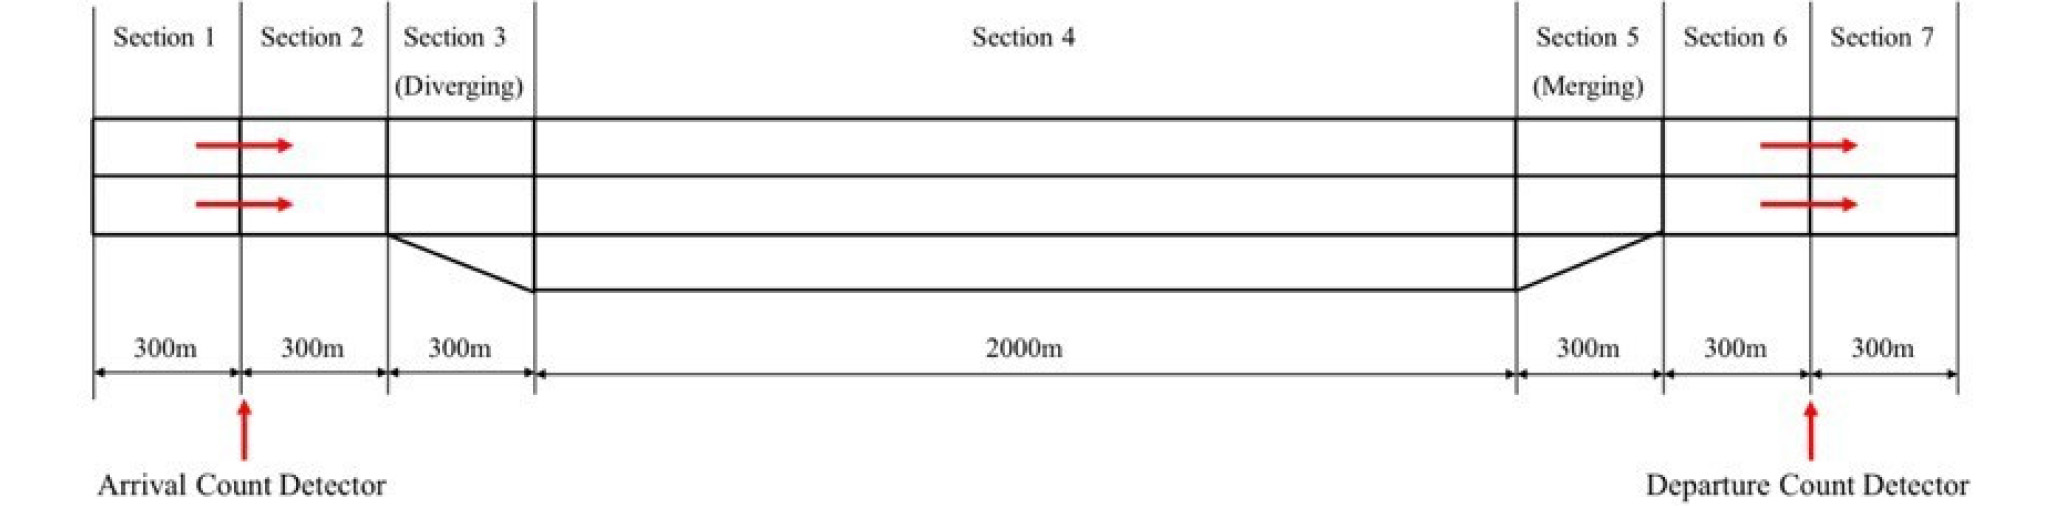
In Korea, there are 87 uphill sections with climbing lanes installed. Each of them have different geometric characteristics (i.e. section length, slope and the number of lanes) and traffic conditions (i.e. average daily volume and heavy class vehicle ratio). A simulation study of all of the uphill sections is inappropriate for the goals of this study. For the objective of this study, the geometric features are simply assumed as shown in Figure 5. The total length and slope of the roadway are assumed to 2km long and 4% respectively.
Calibration process for the simulation parameters is unnecessary as the purpose of this study is to analyze the traffic characteristics at uphill section according to different types of climbing lane rather than to compare the simulation results to actual traffic. In other words, this study focuses on analyzing the general characteristics of freeway traffic in different climbing lane type. Thus, it does not require the optimized traffic parameters obtained from the real traffic data for a specific section. We assume that mean and standard deviation of the parameters are the same as presented in Yeo et al.(2008) except for the free-flow speed, which is set to the restricted speed in Korean expressway. Table 1 shows the mean, standard deviation, and distribution of the simulation parameters. The compliance rate of the climbing lane for heavy class vehicles is extracted from the field data observation.
Table 1. Simulation parameters for climbing lane analysis
Various simulation scenarios involving the traffic volume, heavy class vehicle ratio, and type of climbing lane are exhibited in this study. Next, the simulation is run ten times for each scenario with a different seed to provide stochastic features. Then, the traffic flow efficiency and safety performance of each scenario are evaluated.
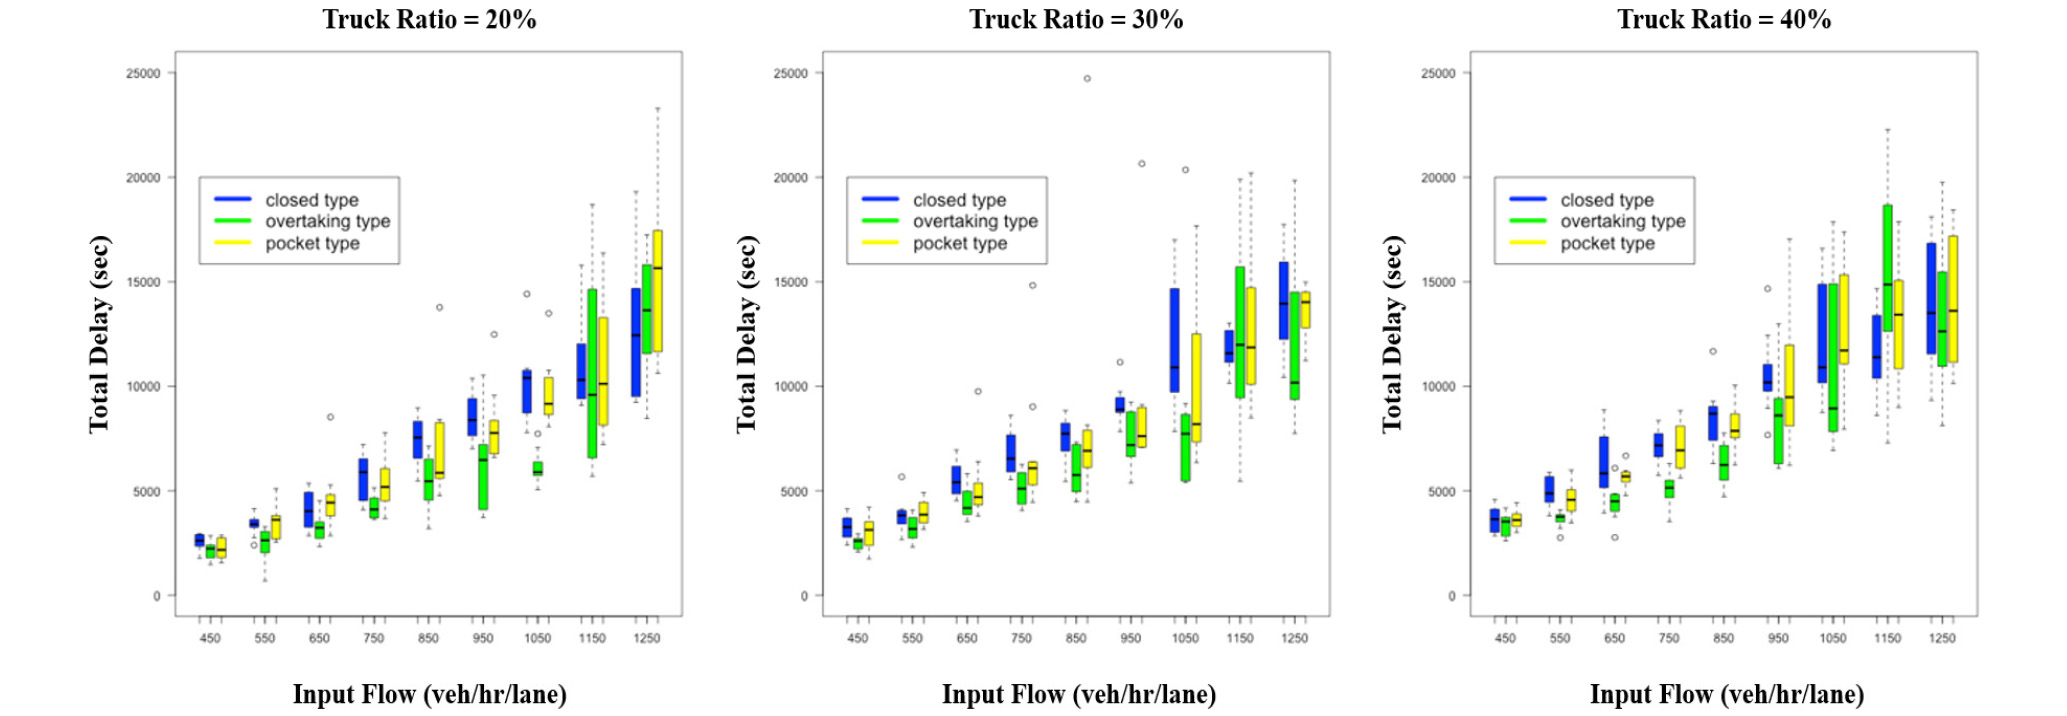
The traffic efficiency is assessed by the total time delay. It is calculated from the cumulative plots of traffic flow at upstream and downstream locations of the roadway. Figure 6 present the total time delay for all scenarios. According to the results, an increase of traffic volume results in higher total delay time. Also, the operation of climbing lane usually provides less amount of total delay time than non-operating case. Compared with the closed type, the overtaking type and pocket type can reduce 20-30% and 10% of total time delay, respectively. However, in cases where traffic volume is over 1300 (vehicle per hour per lane, vphpl), climbing lane does not provide any benefit in total time delay. In summary, the operation of overtaking type of climbing lane at uphill section, where average traffic volume is less than 1300 (vphpl) improves the efficiency of traffic flow.
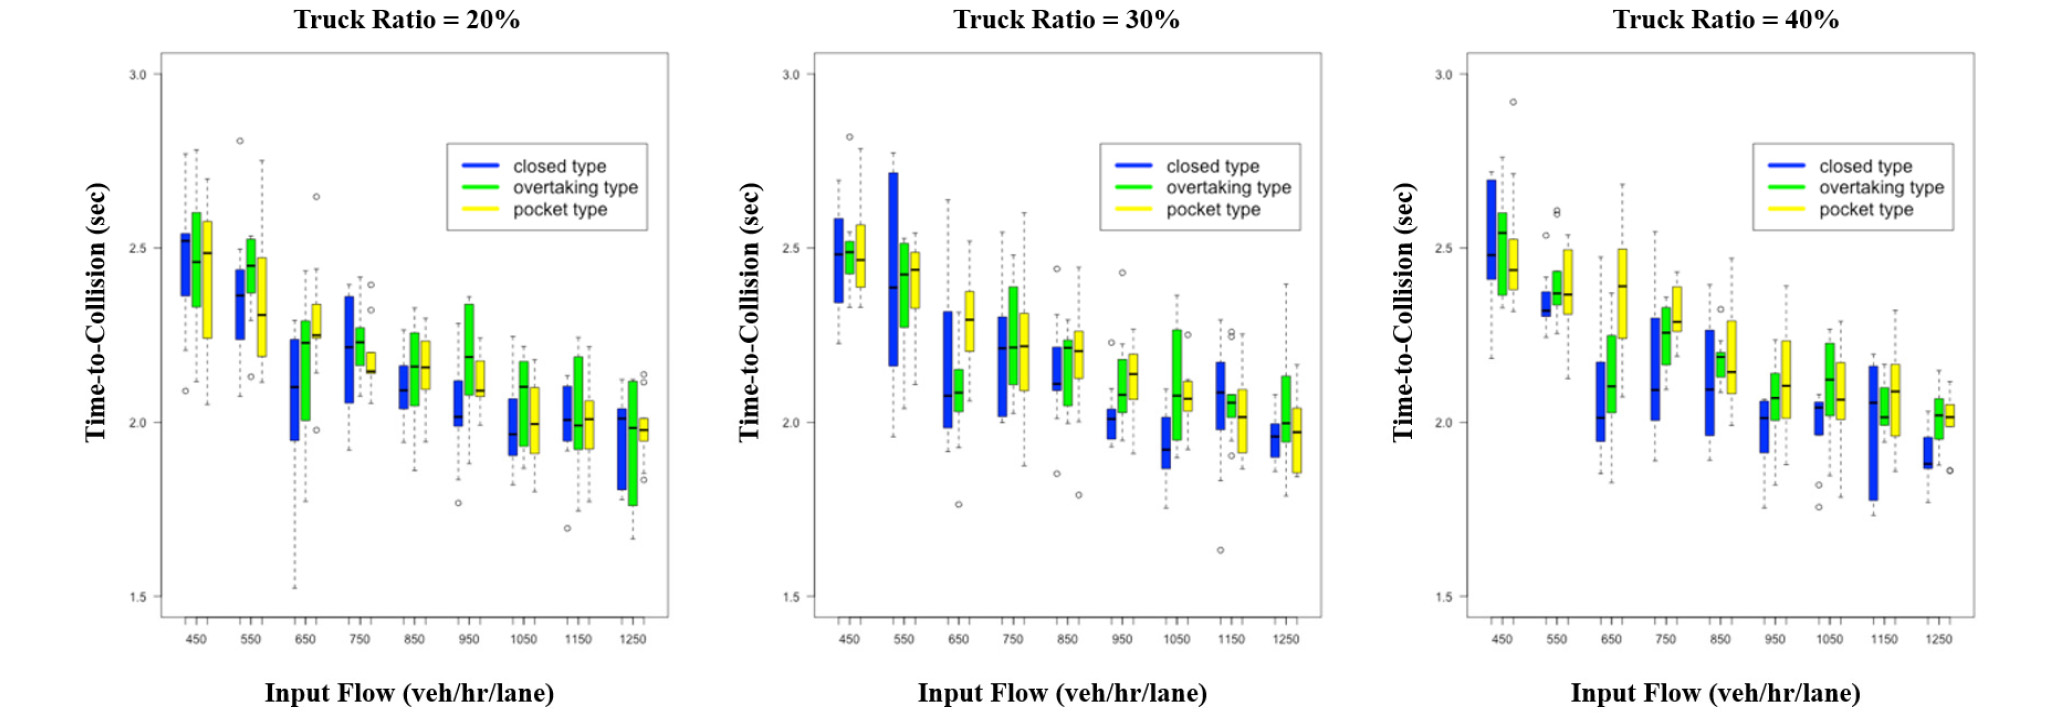
The proposed simulation model is collision-free similar to most of the other existing models. Therefore, a direct measure for safety performance (e.g. the number of crashes) is not provided. According to other researches, there are many indirect ways to survey the safety performance. Time-to-Collision (TTC) is one of the most widely used methods. This is obtained by dividing the spacing of two consecutive vehicles by the relative speed (Hayward, 1972).
Figure 7 show of the average TTC for all scenarios observed. Compared with the overtaking- and pocket- type, the closed type shows a smaller value by approximatively 5 percent. This implies that drivers do not show aggressive behavior in lane-changing when the climbing lane is in operation. Similar to the results of total delay time, the average TTC decreases when the traffic volume increases. In addition, the operation of climbing lane provides benefit in terms of safety performance compared with the closed case.
This section provides a simulation study on freeway traffic characteristics at uphill section with three different types of climbing lane: pocket, overtaking, and closed type. Several scenarios with various traffic volume and heavy class vehicle ratio are simulated and traffic flow efficiency and safety performance are evaluated. As results, it is proven that the operation of both types of climbing lane help reduce the amount of total delay time as well as increase the average TTC value compared with the closed type. However, in high traffic volume, the climbing lane may drop the traffic flow efficiency. In conclusion, an installation of climbing lane at uphill sections and its operation improve both efficiency and safety of freeway traffic when the average traffic volume is less than 1300 (vphpl). Otherwise, the operation of a climbing lane is not recommended.
Conclusions
A simplified microscopic traffic simulation algorithm is developed considering driver’s asymmetric driving behaviors and time synchronization in formulation. This leads to an improvement in memory use and computation. By using the proposed algorithm, an efficiency investigation on freeway traffic flow and safety performance at uphill section with an auxiliary lane type- pocket, overtaking, and closed type, is conducted. In details, we evaluate the performances of the auxiliary lane type at uphill section in terms of travel time delay and time-to-collision by simulating scenarios with different traffic conditions. In summary, this study can contribute in the development of a microscopic traffic simulation algorithm to better describe individual driving behaviors. Also, this leads to the improvement of computing time in formulation and application of microscopic traffic simulation at especially uphill section where a merging car-following behavior is dominant. However, several issues still remain to be explored such as accurate calibration process of the proposed model based on the individual trajectory dataset.
