

BACKGROUND
The driving activity can be considered as comprising of three essential tasks: navigation, guidance, and control. These tasks require the driver to receive inputs, process them, predict alternative actions, and decide which action is the most appropriate, execute the actions, and observe their effects by receiving and processing new information. Because of the decisive role of driving behavior in transportation, driver error is a significant contributing factor in most crashes. Hence, the study of human factors can help analyze traffic accidents. The assessment of drivers’ mental workload may be helpful for improving driving tasks to reduce the number of accidents, which are largely attributed to drivers themselves. According to the existing studies (Ayaz et al., 2012; Wickens et al., 1992), workload concept can be defined and perceived as “the portion of the operator information processing capacity or resources that is required to meet system demands and the mental effort that the operator devotes to control or supervision”. Accordingly, workload is not reflected only on a particular task, but also reports to a person. And workload is defined by the amount of resources required by a set of concurrent tasks, as by the use of resources needed to perform them (Hoedemaeker 2002). Mental workload involves different processes, where neurophysiologic, perceptual and cognitive processes are included, and can be defined as the proportion of information processing capability used to perform a task (Brookhuis and De Waard, 1993a, 2000b).
In the last few decades, driver workload has been analyzed by different methods, such as subjective measurement (Pauzié and Pachiaudi 1997), performance measurement (De Waard 1996), and physiological parameters. Physiological measures appear to be an attractive workload assessment approach as these can be performed without mediation by subjective response or transformation through performance manifestation (Marquart et al., 2015). In physiological measurement, electroencephalographs (EEGs) and electrocardiographs (ECGs) are widely used.
EEG is used to measure the brain’s electrical activity recorded by electrodes placed on the scalp. It provides a promising approach for monitoring the mental workload of drivers (Lei et al., 2009). Several studies identified differences in the alpha band to be most sensitive for distinguishing between different levels of workload. Increases in driving difficulty and mental workload were most often associated with a decrease of alpha and an increase of theta power (Klimesch, 1999; Scerbo et al., 2003; Smith et al., 2001). Gamma waves relate to neural consciousness via the mechanism for conscious attention. Gamma waves are observed as neural synchrony from visual cues in both conscious and subliminal stimuli (Melloni et al., 2007; Siegel et al., 2008; Gregoriou et al., 2009; Baldauf et al., 2014). This research also sheds light on how neural synchrony may explain stochastic resonance in the nervous system (Ward et al., 2006). Gamma Waves are also implicated during Rapid eye movement sleep and anesthesia, which involves visualizations (Vanderwolf et al., 2000). Changes in EEG characteristic and event-related potentials that reflect the workload levels have been identified (Wilson et al., 1988; Gevins et al., 1998; Raabe et al., 2005). Raabe et al.(2005) revealed that the amplitude varies with the task load or task difficulty. Gevins et al.(1998) applied the fast Fourier transform (FFT) to examine the changes in the frequency characteristics, which facilitates understanding how the ratio of a specific frequency band changes when the mental workload changes.
In this study, we analyzed the EEG of drivers driving along bending roads through a simulation test to understand the characteristics of the drivers’ EEG for workloads under different road conditions, such as for a straight road, an S-shaped curve, and a winding curve.
BASIC INFORMAITON OF EEG
Electroencephalography is an electrophysiological monitoring method to record the electrical activity of the brain. It has some characteristics that are favorable for behavioral testing or for subjects who are incapable of making a motor response. The human brain is largely divided into four areas: frontal lobe, temporal lobe, parietal lobe, and occipital lobe; changes are observed in the key features of each of these regions.
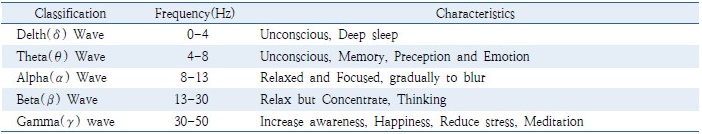
Electrode locations and names are specified by the International 10-20 system for most clinical and research applications (except when high-density arrays are used) (Towle et al., 1993). Based on this system, eight channels of sensor attachment are applied for the frontal lobe (Fp1 and Fp2), temporal lobe (T3 and T4), parietal lobe (F3 and F4), and occipital lobe (O1 and O2). Most of the cerebral signals observed in scalp EEGs are in the range 1-50 Hz. Most of the waveforms in an EEG in clinical practice are subdivided into bandwidths known as alpha (α), beta (β), theta, delta, and gamma (γ) waves.
EXPERIMENT AND DATA COLLECTION
1. Driving Scenarios
Two drivers were tested every day under conditions incorporating different human status in driving scenarios. One driver drove in the morning from 9:30 to 11:30 h, and the other driver drove in the afternoon from 13:30 to 15:30 h. Each driver first filled out basic personal information in a form, adjusted the equipment, and studied and practiced before driving. Each driver exercised twice for the driving test after familiarizing with the equipment and procedures. The apparent distance was 500 m. The traffic volume was 150 veh/h, while the maximum speed was 110 km/h. Given the timeslots, the test drivers were informed that they should drive the test vehicle used in the simulation according to their habitual way of driving.
2. Study Area
The experiment was based on the route from Singal JC (61.2 km) to Incheon IC (79.6 km) of the Yeongdong Expressway in Gyeonggi-do, Korea. A total distance of 20 km had to be driven in the driving simulation experiment. This roadway was a three-lane roadway (3.6 m/lane). The traffic volume was 450/h. The maximum speed was 110 km/h, while the minimum speed was 50 km/h. No change in the travel lane, lateral position error or error widths, and speed limit actually existed in the study area.
3. Participants
For the experiment, test drivers from among the public and from different occupations were invited. In all, 28 test drivers (Mean age = 36.86, S.D. = 10.12), half of them male, and the other half female, were recruited. Fifteen drivers had experienced traffic accident experiments, while nine had participated in simulated driving experiments. Most of them did not have similar experiences. The test drivers were in good health and emotional status and were involved in the experiment for 14 days. All drivers had significant differences to better illustrate the differences between the lateral position error and human factors.
4. Apparatus
The virtual reality driving simulator (Expressway Time (traffic, information, management, and environment) Tracker) can be considered to comprise of three groups: hardware features, software configuration, and applications. The simulator delivered a controlled environment in a safe manner. Accordingly, the visual and sound system, cabin and CFLS, simulation software, and electrical motion platform were included. The software configuration comprised a SCANeR studio, which provided actual driving environments (i.e., vehicles, traffic conditions, and road alignments) for analysis. The simulator was good at evaluating and validating the road-driver-vehicle interactions. It also supported the information on road design, management and operation, ITS, traffic safety, road driving environments for the analysis method, road environment, and vehicle development. The simulated driving test system for the actual information on the highway was installed in a computer by using three-dimensional (3D) computer graphics with a 3D view module according to the topography of the road, construction, and other vegetation environments. The test drivers wore brainwave testers. Face-LAB was used to obtain the driving maneuvering data.
FINDINGS
1. Basic EEG Information
The results of the experimental manipulation of mental workload on EEG wave accuracy, objective workload and number of curves correctly are summarized in Table 1.
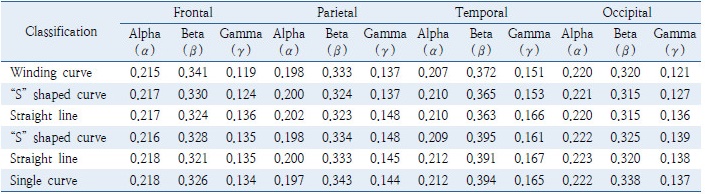
Table 2 presents the driver’s alpha (α) and beta (β) and gamma (γ) wave under different curve conditions. The EEG wave is shown for different curve conditions corresponding to the driver’s different brain functions. Alpha (α) and beta (β) and gamma (γ) are used to measure the degree of change under four curve conditions and trends in the driver’s workload. The table shows that with an increase in the number of curves, the driver’s beta (β) band increased, the degree of change is big and the reactions are obvious. On the contrary, with an increase in the number of curves, the driver’s alpha (α) and gamma (γ) band decreased, and at the same time, alpha (α) band has the smallest change, it is the most stable.
2. Basic EEG Information
There are many methods for the measurement and analysis of biological signals. These methods include the non-reactive (β / α) and FFT method and the root mean square (RMS) method. In this work, we used the relaxation / stress index (β -α) / α method to determine the extent of the workload of the driver in the driving process (Oh et al., 2015; Klimesch, 1999; Scerbo et al., 2003; Smith et al., 2001).
Workload = relation/stress index = (β - α)/α × 100% (1)
For the analysis, depending on the road conditions (horizontal bending), the workload for the four functional areas of the brain were obtained, as shown in Figure 4. From the whole point of view, the drivers’ workload grew as the distance traveled increased. From the perspective of road conditions, the drivers’ workload increased in the winding curve; and decreased under straight road conditions. Meanwhile, for a given situation, with the increase in travel time, the drivers’ workload increased.
Drivers’ workload under complex road conditions (“S” shaped curve and winding curve) is large workload than that under simple road conditions (single curve and straight line). However, the increase in driving time, rather than road conditions, has a more significant effect on the workload. Compared with each other lobe, the temporal lobe has the greatest change extent workload and the occipital lobe has the smallest change extent workload.
3. Driver Workload Regression Equation Model
Studies have shown that different evaluation methods should be applied to different task situations and mental workload levels, and it is unrealistic to attempt to comprehensively reflect the mental workload conditions under different task situations by using one indicator. Therefore, using multiple techniques to comprehensively evaluate mental workload is a reasonable method as an alternative to the single method or index-based evaluation.
Driver’s workload corresponding to the gamma (γ) band on the different curves conditions was subject to great influence of chronological order, and the simply value can’t be a good value for the dynamic process of driving activity for the driver’s workload situations. In this experiment, the driver driving activity passed through the winding curve, straight road, “S” shaped curve, straight road and single curve. By regression equation, the driver frontal lobe, temporal lobe, parietal lobe and occipital lobe four kinds workload and the gamma (γ) band were analyzed. On the four regression equations, the estimated parameters of the model of frontal lobe EEG workload (| t | > 1.96 and sig < 0.05) is significant at 5% confidence level. R-square is also presented to assess the performance of the estimated model. Based on the estimated results, the R-square (R-square = 0.80) is reasonably acceptable. This is because that humans are simply harder to predict than, say, physical processes. Furthermore, though the R-square value is low, there was a statistically significant predictors, we can still draw important conclusions about how changes in the predictor values are associated with changes in the response value. Regardless of the R-square, the significant coefficients still represent the mean change in the response for one unit of change in the predictor while holding other predictors in the model constant. In other words, this assumption equation clarifying the relationship between the human physiological factors can be very matched in Frontal Lobe. However, the other three models have not been verified, while the equation R-square and significant value can’t be accepted.
RESULTS AND DICUSSION
By simulating driving, drivers’ workload under different road conditions (straight lines, single curves, S-shaped curves, and winding curves) was analyzed. For the four functional areas of the brain, the beta (β), alpha (α), gamma (γ) waves and the relationship between workload and gamma (γ) waves under different road conditions were analyzed.
After sorting through the data, we can conclude that, firstly, with an increase in the number of curves, the driver’s beta (β) band increased, but alpha (α) and gamma (γ) band decreased in the process of driving. Secondly, Driver’s workload in a complex road conditions (“S” shaped curve and winding curve) had a large workload than in the case of a simple way (single curve and straight line). Thirdly, workload is negatively correlated with gamma (γ) band.
Several studies identified differences in the alpha band to be most sensitive for distinguishing between different levels of workload. For instance, this pattern was found in two studies that used continuous interactive control tasks to manipulate workload (Brookings et al., 1996; Fournier et al., 1999) and a study that used an N-back task to vary working memory load (Gevins et al., 1998).With increasing memory load, workload changes are especially apparent at frontal sites (Gevins et al., 1998; Holm et al., 2009). The formula for calculating the workload is also derived from this point. Beta (β) wave can indicate the driver has a conscious behavior and normal operations. When driver alpha wave decreases with the increase in driving difficulty, beta (β) band increased on the contrary, so driver feels more workload. Gamma waves relate to neural consciousness via the mechanism for conscious attention. Gamma (γ) can be expressed as increased awareness of the driver, increased well-being and reduced pressure. Although there are no drivers driving gamma wave research, but experiments on Tibetan Buddhist monks have shown a correlation between transcendental mental states and gamma waves (O’Nuallain et al., 2009; Kaufman et al., 2005). Such evidence and research in gamma-band oscillations may explain the heightened sense of consciousness, bliss, and intellectual acuity subsequent to meditation. Notably, meditation is known to have a number of health benefits: stress reduction, mood elevation, and increased life expectancy of the mind and its cognitive functions. According to the test results, the driver’s gamma (γ) wave was maximum when traveling on the straight road, and can reduce the workload.
While the study succeeded in the analysis of mental workload, the study design limits the diversity of the data. Firstly, the study designed a fixed traffic flow, and vehicles traveling on a fixed vehicle line as the baseline conditions. Secondly, the conditions of road operation are single, and the complexity of traffic environment is not fully considered. Thirdly, experimental road distance is relatively short, there is no sufficient EEG data to do the regression analysis of samples. Further research will focus on investigating the diverse EEG data under different environmental conditions to validate its reproducibility. Moreover, the workload during other tasks relevant to human behavior, like heart and mental system, will be examined (Klimesch et al., 1993; Niedermeyer 1993). With respect to EEG-based measures, it is essential to evaluate all relevant personal characteristics aspects to ensure the universality and rationality of analysis.
