

서론
문헌고찰
1. 관련 법·매뉴얼 검토
2. 선행연구 고찰
3. 문헌고찰 결과
삼각교통섬 설치 현황 및 철거 사례 검토
1. 삼각교통섬 설치 현황 검토
2. 삼각교통섬 철거 사례 검토
삼각교통섬이 교차로 교통사고에 미치는 영향 분석
1. 분석 개요
2. 삼각교통섬 설치 여부별 교통사고 특성 분석
3. 삼각교통섬이 교차로 교통사고에 미치는 영향 분석
결론
서론
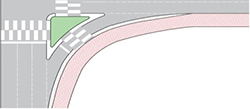
교통섬이란 자동차의 안전하고 원활한 교통처리나 보행자의 도로 횡단 시 안전 확보를 위하여 교차로 또는 차로의 분기점 등에 설치하는 섬 모양의 시설을 말한다. 국내법과 매뉴얼에서는 설치 목적 및 형태에 따라 여러 종류의 교통섬을 제시하고 있으며, 그 중 직진교통류와 우회전교통류를 분리시키고 부적절한 회전 등의 통행을 막기 위해 회전부에 설치되는 시설물을 삼각교통섬이라 제시하고 있다. 이러한 삼각교통섬은 1990년대 교통체계개선사업의 일환으로 전국적으로 광범위하게 설치되어 우회전 처리를 원활하게 하였다. 그러나 최근에는 횡단보행자에게 불편함과 위협을 느끼게 한다는 조사 결과가 제시되고 있다. 2016년 서울연구원에서 시행한 교차로 형태 선호도 조사 결과에 따르면 횡단보행자의 52.0%가 교통신호로 보행 시간을 제공하는 일반교차로를 선호한다고 답변한 반면, 도류화교차로는 31.0%만이 선호하는 것으로 나타났으며, 삼각교통섬 횡단 보행 관련 불편·위험 조사 결과 90.8%의 응답자가 보도에서 삼각교통섬까지 횡단 중에 차량 진입으로 인해 불편 또는 위협을 느낀 적이 있다고 답변하였다. 또한, 한국교통안전공단에서 실시한 삼각교통섬에 대한 국민 인식조사 결과에 따르면, 응답자 중 94.9%가 삼각교통섬으로 횡단 시 차량으로 인해 위험하다는 생각을 한다고 답변하였다. 이러한 설문 결과로 미루어 보아, 기존에 설치된 삼각교통섬이 보행자 횡단 시 안전섬의 역할을 제대로 하지 못하는 등 제 기능을 수행하지 못하는 경우가 있는 것으로 판단된다. 이에 본 연구에서는 삼각교통섬의 설치 현황 및 철거 사례 조사를 통해 삼각교통섬에 대한 현황을 분석하였다. 또한, 실제로 교통사고에 어떠한 영향을 미치는지 분석하여 운영실태를 파악하는 것을 목적으로 통계분석을 실시하여 삼각교통섬이 교차로 교통사고에 미치는 영향에 대해 분석하였다.
문헌고찰
1. 관련 법·매뉴얼 검토
관련 법과 매뉴얼을 통해 삼각교통섬의 정의 및 설치 준거를 검토하였다. 먼저,「도로의 구조·시설 기준에 관한 규칙」(MOLIT; Ministry of Land, Infrastructure and Transport, 2021)과「농어촌도로의 구조·시설기준에 관한 규칙」(MOIS; Ministry of the Interior and Safety, 2021b)에 따르면 교통섬이란 차량의 안전하고 원활한 교통처리나, 보행자 또는 자전거의 안전한 도로횡단을 위하여 교차로 또는 차도의 분기점 등에 설치되는 섬 모양의 시설을 말한다.「평면교차로 설계지침」(MOLIT, 2015)에서는 교통섬, 도류대, 분리대, 대피섬 등의 도류시설물들을 대표적으로 부르는 명칭으로서 교통섬을 정의하고 있으며, 이는 교차로 내부 경계를 명확히 하기 위하여 설치하는 시설물이다. 이러한 교통섬은 그 기능과 목적 유지를 위해 일정한 형태로 되어있는 것이 아니라 교차로 및 주변의 여건에 따라 여러 가지 형태로 설치된다. 「평면교차로 설계지침」(MOCT; Ministry of Construction and Transportation, 2004), 「평면교차로 설계지침」(MOLIT, 2015), 「보행안전 및 편의증진에 관한 법률 시행규칙」(MOIS, 2017), 「교통약자의 이동편의 증진법 시행규칙」(MOLIT, 2020a), 「도로의 구조·시설 기준에 관한 규칙 해설」(MOLIT, 2020b)에서는 교통섬의 종류를 제시하고 있다. Table 1은 국내법과 매뉴얼에 제시된 교통섬의 종류를 형태와 기능에 따라 5가지 유형으로 분류한 것이다. 국내법에서 제시하고 있는 삼각교통섬의 설치 준거는 다음과 같다. 「도로의 구조·시설 기준에 관한 규칙」(MOLIT, 2021)은 제32조 3항에 평면으로 교차하거나 접속하는 구간에서는 ‘필요에 따라’ 교통섬 등의 도류화시설을 설치할 수 있다고 제시하고 있다.「농어촌도로의 구조·시설 기준에 관한 규칙」(MOIS, 2021b)은 제24조 2항에 도로가 동일평면에서 교차하거나 접속하는 경우에는 ‘필요에 따라’ 교통섬을 설치할 수 있다고 제시하고 있다.「보행안전 및 편의증진에 관한 법률」(MOIS, 2021a)은 제15조 1항에 보행자의 안전을 확보하고 통행 편의를 증진하기 위하여 ‘필요하다고 인정하면’ 보행환경개선지구 안의 도로에 교통섬 등 보행자의 안전을 위한 시설을 우선적으로 설치할 수 있다고 제시하고 있다.
Table 1.
Categories of the traffic island
2. 선행연구 고찰
1) 삼각교통섬과 교통사고 간 관계에 대한 연구
삼각교통섬과 교통사고의 관계에 대해 분석한 선행 연구 검토 결과는 Table 2와 같다. 기존에는 삼각교통섬이 사고 감소를 위해 설치된 만큼 주로 삼각교통섬 설치에 따른 사고 감소 효과에 대해 연구된 것으로 나타났다. 해당 연구들은 주로 교통사고 잦은 곳으로 선정되어 삼각교통섬 설치를 통해 개선사업이 이루어진 교차로에 대해 진행된 것으로 나타났으며, 일부 교차로 유형과 사고 유형에서는 삼각교통섬 설치가 교통사고 감소에 기여하지 못하고, 반드시 사고감소로 이어진다고 보기 어려운 것으로 나타났다.
Table 2.
Review of precedent studies I (relationship between triangular island and traffic crash)
| Author | Analysis method | Conclusion |
| Jang and Ryu (2006) |
before and after study statistical method |
In some cases, the installation of triangular islands was found to have the effect of reducing crashes. However, since traffic crashes do not occur due to one cause, it is difficult to conclude that the installation of the triangular island necessarily leads to a reduction in crashes. |
| Lee et al. (2009) |
statistical model comparative risk |
It was analyzed that the installation of the triangular island did not affect traffic crashes of pedestrians (based on the significance level of 10%). And it was found that the risk of crashes differed by installation of triangular islands depending on the size and traffic volume of the intersection. |
| Kang et al. (2010) |
normality test, t-test, wilcoxon signed rank test |
In some cases, the installation of triangular islands contributes to the reduction of traffic crashes and sometimes does not. |
2) 사고예측모형 개발에 대한 연구
사고예측모형 개발에 대한 연구 검토 결과는 Table 3와 같다. 선행연구에서는 사고예측모형 개발을 위해 다중선형회귀모형·포아송모형·음이항모형·로짓모형·순서형모형 등을 이용한 것으로나타났다. 사고심각도의 경우 종속변수로써 EPDO(Equivalent Property Damage Only)와 순서형 변수를 사용하여 연구한 사례가 있었으며, 순서형 변수를 사용한 경우 사고의 심각도에 따라 종속변수를 3·4단계로 구분하여 분석한 것으로 나타났다.
Table 3.
Review of precedent studies II (model for predicting crashes)
| Author | Model type (reason for using) | Dependent variable | Adopted variable |
| Park and Kim (2012) |
multiple linear regression model (to consider various independent variables) | number of crashes |
AADT (Annual Average Daily Traffic), height of the tunnel |
| Park et al. (2008) |
poisson model, negative binomial model (to analysis data with non-normal distribution) | number of crashes |
traffic volume, number of lanes, length of the dilemma zone, etc. |
| Chung (2010) |
poisson model (to analysis data with sporadic and discrete distributions) |
① number of crashes ② crash severity (EPDO) |
① ADT (Average Daily Traffic), cycle, etc. ② ADT, traffic island, etc. |
| Hauer et al. (2004) |
negative multinomial model (to represent data correctly through a likelihood function) | frequency of crash | AADT, speed limit, etc. |
| Poch and Mannering (1996) |
negative binomial model (to overcome the limitations of the poisson model) | frequency of crash |
geometric elements, traffic-related elements |
| Kang et al. (2002) |
negative binomial model (to analysis data with discrete distribution) | number of crashes |
curve radius, change of superelevation, etc. |
| Park et al. (2007) |
negative binomial model (to analysis data with non-normal distribution and overdispersion) | number of crashes |
ratio of heavy vehicle, traffic volume, etc. |
| Seo et al. (2012) |
logit mdel (to utilize the characteristics of the model that maximizes the utility when choosing an alternative) | crash occurrence status |
AADT, number of lanes, lateral clearance, etc. |
| Na and Park (2012) |
ordered logit model (to divide the dependent variable into four grade) |
crash severity (possible/serious/fatal injury) |
season, time of day, type of crash, etc. |
| Abdel-Aty (2003) |
ordered probit model (to reflect the ordinal properties of variables) |
crash severity (no/possible&evident /severe&fatal injury) |
age of driver, gender of driver, seat belt use, speed ratio, etc. |
| Park et al. (2008) |
ordered probit model (suitable for explaining the data characteristics) |
crash severity (material damage, slight/ serious/ fatal injury) |
ratio of right-turn vehicle, ratio of heavy vehicle, etc. |
| Han et al. (2020) |
ordered probit model (to divide the dependent variable into four grade) |
crash severity (possible/slight/serious/ fatal injury) |
time of day-2pm·9pm·11pm, month of year-May, etc. |
| Lee et al. (2020) |
ordered probit model (mainly used in previous studies) |
crash severity (material damage, slight/ serious/ fatal injury) |
cargo·special car, downhill, speed limit-over 100km/h, etc. |
| Kang et al. (2019) |
ordered probit model (widely used to explain ranked data) |
crash severity (possible/slight/serious/ fatal injury) |
age of driver, drowsy driving, rear-end collision, crash speed, etc. |
| Ha et al. (2005) |
ordered probit model (suitable for explaining the data characteristics) |
crash severity (material damage, slight/ serious/ fatal injury) |
ratio of heavy vehicle, traffic volume, etc. |
3. 문헌고찰 결과
국내법 검토 결과 ‘필요에 따라’, ‘필요하다고 인정하면’이라고 언급하며 명확한 준거를 제시하고 있지 않은 것으로 나타났으며, 선행연구 고찰 결과 삼각교통섬 설치가 반드시 사고감소로 이어진다고 보기 어려운 것으로 나타났다. 다시 말해, 삼각교통섬의 경우 적재적소에 설치하여야 효과를 보이는 것으로, 그렇지 않은 경우 오히려 위험을 초래할 수 있다는 것을 의미한다. 이로 미루어 보아 명확한 설치 준거의 부재로 인해 삼각교통섬이 설치되었으나, 그 기능을 제대로 발휘하지 못하는 경우가 있을 것이라 판단된다. 이에 삼각교통섬이 교차로 교통사고에 어떤 영향을 미치고 있는지에 대한 연구는 시의적절하다고 판단되며, 통계분석을 통해 해당 내용에 대한 분석을 진행하고자 한다. 기존 연구에서는 사고감소를 목적으로 삼각교통섬을 설치한 만큼 설치 전·후에 대한 사고감소 효과에 중점을 두고 사고발생건수 및 사고발생여부 등을 분석했으나, 본 연구는 삼각교통섬이 적절하게 설치되지 못한 경우가 있다는 것을 인지하고, 사고발생건수에 관한 분석을 포함하여 사고심각도 관련 분석을 통해 삼각교통섬이 교차로 교통사고에 미치는 영향을 분석한다는 점에서 기존 연구들과의 차별성을 갖는다.
삼각교통섬 설치 현황 및 철거 사례 검토
1. 삼각교통섬 설치 현황 검토
인천광역시와 국외 5개 주요 도시(도쿄, 런던, 시카고, 로스앤젤레스, 밴쿠버)의 삼각교통섬 설치 현황 검토를 위해, 삼각교통섬 설치 지점 및 교차로당 삼각교통섬 수를 조사하였으며, 조사 결과는 Table 4와 같다. 인천광역시 자료의 경우 민간 디지털지도 사이트를 이용하여 직접 조사하였으며, 국외 주요 도시 자료의 경우 서울연구원의 조사자료를 참고하였다. 검토 결과 인천광역시의 경우 교차로당 1.8개소의 삼각교통섬이 설치된 것으로 나타나, 시카고에 이어 두 번째로 높은 수준을 보였으며, 교차로당 삼각교통섬 수가 가장 적은 로스앤젤레스에 비해서는 1.6배 높은 수준으로 나타났다. 또한, 도시외곽지역은 물론 도심지역의 교차로에 삼각교통섬이 설치되어 있는 인천광역시와는 달리, 런던·시카고·로스앤젤레스·밴쿠버의 경우 삼각교통섬이 주로 보행량이 적은 도시외곽지역에 설치되어 있는 것으로 나타났으며, 도쿄는 도시고속도로와 인접한 교차로에 주로 설치되어 있는 것으로 나타났다(Kim, 2016).
Table 4.
Comparison of the number of triangular islands per intersection by Incheon and major overseas cities
* Refer to Kim (2016, pp. 14-15) for overseas data.
2. 삼각교통섬 철거 사례 검토
철거 사례 조사를 위해 국토정보플랫폼1), 도로교통공단 교통사고분석시스템2), 지자체에서 작성한 보도자료 및 기사3)를 활용하였으며, 조사 결과는 Table 5와 같다. 철거 사례 검토 결과 설치 목적에 부합하지 않고, 오히려 보행자의 안전을 위협하거나 교통흐름을 방해하는 삼각교통섬이 철거된 것으로 나타났으며, 철거된 삼각교통섬 반경 15m 이내에서는 철거 전 5년간 최소 1건 이상의 사고가 발생한 것으로 나타났다. ‘경남 양산 대동아파트 입구 사거리’의 경우 삼각교통섬이 설치된 직후 사고위험으로 인해 바로 철거된 것으로 나타났다. 이러한 검토 결과로 미루어보아 삼각교통섬이 설치 목적과 다른 모습을 보이며, 적재적소에 설치되지 못한 경우가 있다고 판단된다.
Table 5.
As a result of the investigation on the demolition of the triangular island
| Demolition site* | Reason for demolition* |
Number of crashes |
Number of injuries |
|
Gangil 3rd and 6th complex intersection in Gangdong-gu, Seoul1) |
∙ Turning radius of heavy vehicle is insufficient. ∙ The pedestrian queuing areas on the triangular island is cramped. ∙ Triangular island obstructs traffic on the road. | 12 | 18 |
|
Gangil 4th, 5th and 7th complex intersection in Gangdong-gu, Seoul1) |
∙ Turning radius of heavy vehicle is insufficient. ∙ The pedestrian queuing areas on the triangular island is cramped. ∙ Triangular island obstructs traffic on the road. | 9 | 22 |
|
The northern end of Gwangjin bridge in Gwangjin-gu, Seoul2) |
∙ There is a risk of pedestrian traffic crashes due to the high speed of right-turn vehicles. | 6 | 9 |
|
Yeongdeungpo Marcket Intersection in Yeong- deungpo-gu, Seoul4) |
∙ There is a risk of pedestrian traffic crashes due to the high speed of right-turn vehicles. ∙ It threatened the elderly’s walking safety. | 38 | 45 |
|
Intersection in front of the Hankyoreh newspaper in Yongsan-gu, Seoul3) |
∙ It provides convenience to right-turn vehicles even though there is not much traffic. ∙ There is a large floating population over the entire period. | 1 | 1 |
|
Gyeongbokgung station intersection in Jongno-gu, Seoul4) |
∙ There is a risk of conflict with pedestrians due to the large number of right-turn vehicles when crossing from the sidewalk to the triangular island. ∙ The area around the subway entrance is cramped. | 4 | 6 |
|
Intersection in front of Jangseo elementary school in Namdong-gu, Incheon5) | ∙ There are many children pedestrians in this site. | 4 | 7 |
|
Intersection in front of the Korea Coast Guard in Yeonsu-gu, Incheon** | - | 3 | 4 |
|
Cheongna international city entrance intersection in Seo-gu, Incheon** | - | 4 | 7 |
|
Igu three-way intersection in Gimhae, Gyeongsangnam-do6) |
∙ It was demolished to prevent traffic crashes on the way to school for students. ∙ It was demolished to reduce the speed of the right turn vehicle | 15 | 26 |
|
Daedong apartment intersection in Yangsan, Gyeongsangnam-do7)*** |
∙ The risk of crashes increased due to a triangular island. ∙ A triangular island was installed at an intersection where traffic was already facilitated. | - | - |
|
Modular industrial complex intersection in Buk-gu, Ulsan8) |
∙ Due to the lack of left-turn waiting space, left-turn vehicles interfere with straight traffic flow. | 4 | 8 |
1)Gangdong-gu Office (2018, December 12), Create a Safe Walking Environment by Maintaining Traffic Islands in Gangil District, Press release of Gangdong-gu Office in Seoul, South Korea.
2)Lee Y. H. (2014, August 16), The Transportation System around Gwangjang-dong will Change Significantly for Pedestrians, Sungkwang Ilbo.
3)Seoul City Hall (2019, May 8), Seoul, 7 Site where Traditional Markets and Subway are Located will be Customized and Improved within this Year, Press release of Seoul City Hall, South Korea.
4)The Seoul Institute (2017), Manual for Design and Management of Streets in Seoul, South Korea.
5)Kim H. C. (2019, Jun 3), Incheon Seochang Residents' Association, 'Yoon Gwan-seok, Don't Intercept Residents' Performance, Incheon Today.
6)Gimhae City Hall (2015, December 29), Construction to Improve Traffic Accident Risk Areas around Gusan High School, Press release of Gimhae City Hall, South Korea.
7)Son S. Y. (2007, September 11), "Traffic Island" That Disappeared in an Immediate, Yangsan Ilbo.
8)Kim Y. S. (2012, August 21), Ulsan, Completed the 'Improvement Project at Black Spot', 9 Site Including Ewha Overpass on Industrial Road and Okgyo Intersection on Gangbuk-ro, BCP&ERM.
삼각교통섬이 교차로 교통사고에 미치는 영향 분석
1. 분석 개요
1) 분석 방법론
교통사고의 발생은 산발적이고 이산적인 형태의 분포를 나타낸다. 이에 포아송모형을 이용한 분석이 흔히 이루어지는데, 해당 모형은 분포의 평균과 분산이 같아야 한다는 가정을 기반으로 한다. 하지만, 교통사고 자료 분포의 경우 언제나 평균과 분산이 같지만은 않다. 분포의 분산이 평균보다 큰 자료 즉, 과대산포의 형태를 띄는 자료의 경우 음이항모형을 사용한다(Park et al., 2008).
한편, 사고심각도 예측을 위해 일반적으로 사용되는 모형으로는 순서형 프로빗모형과 순서형 로짓모형이 있다.이들은 자료의 순서형 서열을 모형화하는 기초로 변수 를 정의하여 도출하고, Equation 1과 같이 각 관측치에 대한 선형함수로 정의된다. 이를 이용한 각 관측치에 대한 순서형 자료 y는 Equation 2와 같이 정의되며, ‘전혀아님’, ‘보통’, ‘매우 그러함’과 같은 내용을 1,2,3으로 변환하여 나타낸다(Washington et al., 2003).
여기서, : 관측치 에 대한 이산적 서열을 결정하는 변수의 벡터,
: 추정가능한 매개변수의 벡터
각각의 설명변수가 사고심각도에 미치는 영향을 나타내는 한계효과(Marginal effects)는 설명변수에 편미분을 적용하여 나타낼 수 있다. 더미변수인 경우(X=0 또는 1) 설명변수가 사고심각도에 미치는 영향도를 나타내는 한계효과는 다른 설명변수를 고정한 상태에서 설명변수가 1인 경우의 선택확률과 0인 경우의 선택확률의 차이를 의미한다. 따라서 각 설명변수에 대한 한계효과의 합은 0이 된다(Ha et al., 2005).
모형 전반의 적합도를 알아보기 위한 일반적인 척도는 우도비(Likelihood ratio) 이다. 이는 통계량과 목적면에서 유사하며, 때로는 McFadden 통계량이라고 불리기도 한다. 우도비 산출식은 Equation 3와 같으며, 이 중 는 유의한 변수를 모두 포함한 모형의 로그우도(log-likelihood) 값이고, 은 모든 파라미터가 0으로 설정된 초기 로그우도 값이다. 우도비는 0과 1 사이 값을 가지며, 통계량이 1에 가까울수록 모형이 결과를 더 정확하게 예측함을 나타낸다(Washington et al., 2003).
본 연구에서는 삼각교통섬이 교차로 교통사고에 미치는 영향을 분석하기 위해 통계분석 프로그램 LIMDEP 9.0을 이용하여 사고건수 예측모형과 사고심각도 예측모형을 구축하였다. 가산자료의 형태를 띄는 사고건수의 경우 가산모형인 음이항모형과 포아송모형을 이용하였으며, 서열형이자 범주형인 사고심각도의 경우 순서형 프로빗모형을 이용하였다. 모형의 적합도 판정을 위해서는 앞서 설명한 바와 같이 우도비를 이용하였다.
2) 분석 자료 수집
삼각교통섬이 교통사고에 미치는 영향 분석을 위해, 시간적 범위를 2017년부터 2020년까지로 설정하였으며, 공간적 범위는 인천광역시 내 교차로 중 시간적 범위 내에 기하구조 변화가 없는 교차로 70개소로 설정하였다. 선행연구에서 채택된 변수들을 참고하여 Table 6와 같이 조사대상 항목을 선정하였으며, 교차로의 기하구조에 관한 자료는 민간 디지털지도 사이트의 스카이뷰와 로드뷰를 이용하여 수집하였다. 교통량 자료의 경우 「2020 도시교통 기초조사 최종보고서」(Incheon Metropolitan City, 2021)를 참고하였으며, 사고자료는 도로교통공단 교통사고분석시스템을 통해 조사하였다. 전체 70개소 중 삼각교통섬이 설치된 교차로는 47개소, 미설치된 교차로는 23개소로 나타났다. 해당 교차로에서 2017년부터 2020년까지 4년간 발생한 교통사고 건수는 총 1,475건이었으며, 그 중 사망사고는 18건, 중상사고는 434건, 경상사고는 978건, 부상신고사고는 45건 발생한 것으로 나타났다(Table 7).
Table 6.
The subject of investigation for the analysis of the influence of triangular islands on intersection traffic crashes
Table 7.
The results of data investigation
2. 삼각교통섬 설치 여부별 교통사고 특성 분석
교차로 내 삼각교통섬 설치 여부별 교통사고 특성을 비교·분석하기 위해, 4년간의 사고건수를 교차로 수로 나눈 교차로당 평균사고발생건수를 비교하였다. 먼저 사고등급별 평균사고발생건수 분석 결과, 부상신고사고 및 경상사고는 삼각교통섬이 설치되지 않은 교차로에서 더 많이 발생하는 것으로 나타났으며, 중상사고 및 사망사고는 삼각교통섬이 설치된 교차로에서 더 많이 발생하는 것으로 나타났다. 이어서 사고등급·사고발생계절·사고발생시간대·노면상태·사고유형·법규위반유형·운전자차종·운전자연령대별 평균사고발생건수 분석 결과, 교차로 내 삼각교통섬 설치 여부에 따라 각각 다른 특성을 보였으며, 상세 분석 결과는 Table 8과 같다.
Table 8.
Total and average number of traffic crashes by type
3. 삼각교통섬이 교차로 교통사고에 미치는 영향 분석
1) 삼각교통섬이 교차로 교통사고 건수에 미치는 영향 분석
삼각교통섬이 교차로 교통사고 발생건수에 미치는 영향을 분석하기 위해 종속변수가 사고건수인 예측모형을 구축하였다. 모형 구축을 위한 독립변수는 삼각교통섬과 관련된 주요 변수인 교차로 내 삼각교통섬 설치 여부·삼각교통섬 평균 면적을 포함하여 Table 9과 같이 48개의 변수를 이용하였다. 각각 독립변수들의 단위·범위를 일정한 수준으로 맞춰 분석하기 위해, Feature Scaling 기법 중 하나인 Min-Max Scaling 기법을 사용하여 데이터의 범위를 0-1 사이 값으로 전처리하여 활용하였다.
Table 9.
Definition of variables for the model for predicting the number of crashes
과산포 파라미터가 95% 신뢰수준에서 통계적으로 유의하지 않는 것으로 나타나, 포아송모형을 이용하여 모형을 구축하였다. 본 연구에 있어 주요한 변수인 삼각교통섬의 유무와 평균 면적의 경우 당초 설정한 신뢰수준인 95%를 만족하지 못하는 것으로 나타났다. 본 연구의 목적이 정확한 사고건수 예측이 아닌 삼각교통섬이 교통사고에 미치는 영향을 분석하는 것인 만큼, 오차항에 영향이 없되 주요 변수들이 모형에 포함될 수 있도록 신뢰수준을 조정하여 분석을 진행하였다. 분석 결과, 사고건수 예측모형 구축을 통해 채택된 변수는 총 12개로 나타났다. 교차로 내 삼각교통섬 유무는 사고건수에 음의 영향을 미치는 것으로 나타나, 삼각교통섬의 설치는 사고 감소 효과를 보이는 것으로 나타났다. 삼각교통섬의 평균 면적 또한 사고건수에 음의 영향을 미치는 것으로 나타나, 삼각교통섬의 면적이 커질수록 사고 감소 효과를 보이는 것으로 나타났다. 삼각교통섬과 관련된 변수 외에도 차종별 우회전 비율, 방향별 교통량, 교차형태, 차로수, 좌회전전용차로유무, 감속차로설치여부가 사고 건수에 영향을 미치는 요인으로 분석되었으며, 상세 분석 결과는 Table 10과 같다.
Table 10.
The result of constructing a model for predicting the number of crashes
| Variable | Coefficient | p-value | Elasticity |
Marginal effects | |||
| Constant | 0.780 | - | - | - | |||
| Existence of the triangular island | -0.092 | 0.210 | - | -1.936 | |||
| Average area of the triangular island | -0.333 | 0.107 | -0.043 | - | |||
| Proportion of two-wheeler turning right on the major road | 13.298 | 0.000 * | 0.274 | - | |||
| Total traffic volume of turning left on the major road | 3.936 | 0.000* | 0.414 | - | |||
| Total traffic volume of straight on the major road | 1.068 | 0.000 * | 0.342 | - | |||
| Total traffic volume of turning right on the major road | -3.491 | 0.001 | -0.354 | - | |||
| Total traffic volume of turning left on the minor road | 6.566 | 0.000* | 0.660 | - | |||
| Total traffic volume of straight on the minor road | 1.594 | 0.000* | 0.232 | - | |||
| Crossing type (4way:1, 3way:0) | 0.466 | 0.000 * | - | 9.814 | |||
| Average number of lanes on the major road | 0.917 | 0.000 | 0.499 | - | |||
|
Existence of exclusive left turn lane on the major road (existence:1, nonxistence:0) | -0.250 | 0.056 | - | -5.258 | |||
|
Existence of deceleration lane on the major road (existence:1, nonxistence:0) | -0.235 | 0.001 | - | -4.958 | |||
| ∙ Observations : 70 | ∙ : 0.562 | ∙ : -535.175 | ∙ : -234.318 | ||||
2) 삼각교통섬이 교차로 교통사고 심각도에 미치는 영향 분석
삼각교통섬이 교차로 교통사고 심각도에 미치는 영향을 분석하기 위해 종속변수를 사고심각도에 따라 4단계(부상신고사고, 경상사고, 중상사고, 사망사고)로 구분한 사고심각도 예측모형을 구축하였다. 독립변수는 앞서 사고건수 모형 구축 시 사용하였던 변수 48개에 Table 11과 같이 사고 관련 더미변수 70개를 추가하여 분석을 진행하였다.
Table 11.
Definition of variables for the model for predicting crash severity
*As for the independent variable, only the added crash-related variables are presented in the table. Refer to Table 9 for intersection-related variables.
분석 결과, 사고심각도 예측모형 구축을 통해 채택된 변수는 총 17개이다. 먼저, 삼각교통섬의 설치 여부는 사고심각도에 음의 영향을 미치는 것으로 나타나, 삼각교통섬 설치시 중상사고, 사망사고와 같은 심각도가 높은 사고의 발생확률이 미설치시 대비 7.78% 감소하는 것으로 분석되었다. 삼각교통섬의 면적은 사고심각도에 양의 영향을 미치는 것으로 나타나, 삼각교통섬의 면적이 커질수록 심각도가 높은 사고의 발생확률이 높아지는 것으로 분석되었다. 이 외에도 횡단보도수·교통량·사고발생일시·법규위반형태·사고유형·운전자의 차종·연령·성별이 사고심각도에 영향을 미치는 것으로 나타났으며, 상세 분석 결과는 Table 12와 같다.
Table 12.
The result of constructing a model for predicting crash severity
| Variable | Coefficient | p-value | Marginal effects | |||||||||||
|
Possible injury |
Slight injury |
Serious injury |
Fatal injury | |||||||||||
| Constant | 1.914 | - | - | - | - | - | ||||||||
| Existence of the triangular island | -0.225 | 0.060 | 0.010 | 0.068 | -0.075 | -0.003 | ||||||||
| Average area of the triangular island | 0.392 | 0.126 | - | - | - | - | ||||||||
| Number of crosswalks | 0.675 | 0.001 | - | - | - | - | ||||||||
|
Proportion of taxi turning right on the major road | -1.585 | 0.003 | - | - | - | - | ||||||||
| Minor road linearity (straight:1, others:0) | -0.183 | 0.023 | 0.008 | 0.056 | -0.061 | -0.003 | ||||||||
| Time of day_03AM-06AM | 0.363 | 0.001 | -0.013 | -0.119 | 0.125 | 0.007 | ||||||||
| Day of week_Friday | -0.185 | 0.045 | 0.010 | 0.050 | -0.058 | -0.002 | ||||||||
| Crash type_Car to pedestrian | 0.856 | 0.000* | -0.021 | -0.304 | 0.295 | 0.030 | ||||||||
| Violation of law_Violation of the signal | 0.694 | 0.000* | -0.028 | -0.219 | 0.233 | 0.014 | ||||||||
| Gender of assailant_Male | 0.271 | 0.001 | -0.015 | -0.072 | 0.085 | 0.003 | ||||||||
| Age of assailant_30s | 0.221 | 0.016 | -0.009 | -0.069 | 0.075 | 0.004 | ||||||||
| Vehicle type of victim_Passenger car | -0.314 | 0.001 | 0.013 | 0.097 | -0.105 | -0.005 | ||||||||
|
Vehicle type of victim_Cargo & Construction-machinery | -0.338 | 0.027 | 0.022 | 0.083 | -0.102 | -0.003 | ||||||||
|
Vehicle type of victim_Motor & Bicycle & PM | 0.577 | 0.002 | -0.016 | -0.201 | 0.202 | 0.016 | ||||||||
| Gender of victim_Male | -0.158 | 0.045 | 0.007 | 0.048 | -0.053 | -0.002 | ||||||||
| Age of victim_Under 20s | -0.618 | 0.009 | 0.053 | 0.116 | -0.166 | -0.004 | ||||||||
| Age of victim_30s | -0.204 | 0.014 | 0.011 | 0.056 | -0.065 | -0.002 | ||||||||
| ∙ Observations : 1,475 | ∙ : 0.113 | ∙ : -1,037.615 | ∙ : -1,169.153 | |||||||||||
3) 삼각교통섬이 교차로 교통사고에 미치는 영향 분석 결과
사고발생건수 및 사고심각도 모형 구축을 통해 삼각교통섬이 교차로 교통사고에 미치는 영향을 분석한 결과, 삼각교통섬의 설치는 사고발생건수 및 사고심각도를 낮추는데 긍정적인 영향을 미치는 것으로 나타났다. 삼각교통섬 평균 면적의 경우, 규모가 커질수록 사고발생건수를 낮추는데 긍정적인 영향을 미치는 것으로 나타났으나, 심각도에는 부정적인 영향을 미치는 것으로 나타났다. 이는, 삼각교통섬이 적합한 위치에 설치되었으나 적절한 형태로 설치되지 않은 사례에서 기인한 것이라 판단된다. 이러한 분석 결과를 통해, ‘삼각교통섬의 적정 면적’ 등과 같은 설계 기준의 개선 필요성이 도출되었다.
결론
본 연구에서는 삼각교통섬에 대한 현황을 알아보기 위해 문헌고찰을 진행하였으며, 설치 현황 및 철거 사례에 대해 검토하였다. 또한, 삼각교통섬이 교차로 교통사고에 어떠한 영향을 미치는지 알아보기 위해 인천광역시를 대상으로 교차로 자료와 사고 자료를 이용하여 통계분석을 실시하였다. 먼저 문헌고찰 및 삼각교통섬 철거 사례 검토 결과, 국내법에서는 삼각교통섬의 명확한 설치 준거를 제시하고 있지 않았으며, 따라서 설치 준거 개발의 필요성이 파악되었다. 또한, 관련 선행 연구에서는 삼각교통섬의 설치가 반드시 사고감소로 귀결된다고 보기 어려운 것으로 나타났다. 이어서 삼각교통섬의 설치 현황 검토 결과, 해외 주요 도시들과 비교했을 때 인천광역시의 교차로당 삼각교통섬 수는 많은 수준인 것으로 나타났으며, 인천광역시와는 달리 해외 주요 도시들은 보행량이 적은 도시외곽지역에 주로 설치되어 있는 것으로 나타났다. 삼각교통섬 설치 수에 대한 타당성에 대해서는 명확한 결론을 내릴 수 없으나, 해외 주요 도시들에서 보행량이 적은 지역에 설치하는 사례는 시사점이 있다. 차량과 보행자 간 상충이 빈번할 것이라 예상되는 경우와 삼각교통섬의 용량을 초과하는 보행자 수가 발생하는 경우는 피하고 있는 점이다. 이는 국내 삼각교통섬 설치 준거 개발시 참고해야 할 사항이라 판단된다. 다음으로 교차로 내 삼각교통섬 설치 여부별 통계분석을 실시한 결과, 부상신고사고 및 경상사고는 삼각교통섬이 설치되지 않은 교차로에서 더 많이 발생하는 것으로 나타났으며, 중상사고 및 사망사고는 삼각교통섬이 설치된 교차로에서 더 많이 발생하는 것으로 나타났다. 또한, 예측모형 분석을 통해 삼각교통섬이 교차로 교통사고에 미치는 영향을 분석한 결과, 삼각교통섬이 설치된 교차로의 경우 사고발생건수 및 사고심각도가 감소하는 것으로 나타났으며, 삼각교통섬의 면적이 클수록 사고건수는 감소하나 사고심각도가 증가하는 것으로 나타났다. 이를 통해 인천광역시에서 지난 4개년 동안 발생한 사고를 대상으로 한 사고 분석에서 중상사고 및 사망사고의 경우 삼각교통섬이 설치된 교차로에서 더 많이 발생하는 것으로 파악된 주된 이유가 삼각교통섬의 면적임을 유추할 수 있었다.
본 연구는 인천광역시를 대상으로 설치와 철거 사례가 빈번한 삼각교통섬에 주목하여, 삼각교통섬의 설치 여부를 고려한 교통사고 발생건수 예측모형 및 심각도 예측모형을 다양한 변수를 도입하여 구축하였다. 다만, 삼각교통섬이 보행자와 밀접한 관계를 가지고 있는 만큼 보행자 데이터가 포함되어야 하나, 사고 당시의 보행자 데이터는 현실적으로 취득이 불가능함으로 후속 연구에서는 시뮬레이션 툴 활용을 고려할 필요가 있다. 또한, 카이스퀘어 테스트를 선행한 후 개별 모형을 구축할 타당성이 인정된다면, 삼각교통섬 설치 여부에 따라 사고 예측모형을 구축할 필요성이 인정된다.
