

INTRODUCTION
LITERATURE REVIEW
1. Reliability of Platform Screen Doors and Rail Door Systems
2. Maintenance Optimization and Life-Cycle Cost Evaluation in Rail Systems
3. Reliability and Maintenance in Autonomous and Demand-Responsive Transit
4. Literature Gap and Contribution Positioning
METHODOLOGY
1. Data
2. Preprocessing and Data Cleaning
3. Reliability
4. Maintenance Strategy Simulation
5. Cost Modeling Specification
6. Sensitivity Analysis
RESULTS
1. Failure Pattern Analysis
2. Maintenance Strategy Simulation
3. Sensitivity Analysis and Optimization
DISCUSSION
1. Reliability Insights
2. Policy Trade-offs and Managerial Interpretation
3. Methodological Limitations
4. Implications for Demand-Responsive Transit (DRT)
CONCLUSION
APPENDIX
INTRODUCTION
In recent years, autonomous and demand-responsive transport (DRT) have emerged as a key innovation in urban mobility. These systems are intertwined with technological, traffic, and operational risks, including safety, uncertain ridership, and the complexity of integrated operations. Although many projects remain at the simulation or pilot stage rather than in full commercial service, recent research trends increasingly evaluate their impacts from the perspective of accessibility (Schlüter et al., 2021; Golbabaei et al., 2024; Park and Kim, 2022).
However, for real-world autonomous DRT operations, it is essential to ensure door system availability from a reliability engineering standpoint, because passenger-handling doors are safety critical components. Unlike conventional public transport with an onboard driver, these services are operated in an unattended mode, so any door failure can directly and severely affect overall operational availability.
Driverless shuttles and on-demand fleets rely on door actuation systems, obstacle detection sensors, and drive control units (DCUs) that perform functions comparable to platform screen doors (PSDs) in railway systems. PSDs are vital safety devices that prevent passenger accidents while improving station energy efficiency and climate control (Lee et al., 2009). Yet their electromechanical subsystems (motors, actuators, and sensors) are frequent sources of service disruptions and maintenance costs. Ensuring their reliability is therefore fundamental to both operational safety and cost efficiency.
Despite extensive research on railway reliability modelling, few studies have analyzed PSDs using large-scale operational data, nor have they linked empirical failure analysis to lifecycle cost optimization. Moreover, although predictive and condition-based maintenance have gained traction in railway and industrial contexts, their application to PSDs, and their methodological relevance to emerging autonomous and demand-responsive transit systems, remains largely underexplored.
To address these gaps, this study analyzes 10 ,078 PSD failure records collected from 279 stations across 18 lines in Seoul Metropolitan Area Railway (2019-2024). A combined Weibull reliability model and Monte Carlo simulation framework is developed to compare four maintenance strategies (reactive, preventive, condition-based, and predictive) and to evaluate their trade-offs in cost, availability, and safety.
The objectives of this research are fourfold:
(1) to quantify reliability patterns and degradation behaviors across PSD components and manufacturers; (2) to evaluate and compare alternative maintenance strategies under uncertainty;
(3) to identify cost-efficient yet safety-preserving parameter settings through sensitivity analysis; and (4) to demonstrate how the same reliability-simulation framework can be reformulated for autonomous and DRT systems through cycle-based exposure modeling.
Although centered on PSDs, the analytical framework is transferable to autonomous and DRT systems, whose door actuators, sensors, and control units share similar reliability characteristics. By reformulating time-based degradation models into cycle-based exposure metrics, the proposed Weibull-Monte Carlo reliability framework provides a foundation for predictive maintenance of safety-critical subsystems in both fixed and mobile transit environments.
The remainder of this paper reviews related work (Section 2), details the dataset and methodology (Section 3), presents results (Section 4), discusses implications and transferability (Section 5), and concludes with recommendations for hybrid maintenance planning (Section 6).
LITERATURE REVIEW
1. Reliability of Platform Screen Doors and Rail Door Systems
The reliability of platform screen doors (PSDs) has typically been assessed using classical indicators such as Mean Time Between Failures (MTBF), failure rates, and B-life measures (Alshahrani, 2017). Consistent evidence shows that PSD and train door systems exhibit wear-out failure behavior, making them well suited for Weibull lifetime modeling (Wang et al., 2024; Aprilia et al., 2024). Prior studies highlight the need to identify failure-prone components and to characterize the degradation behavior of electromechanical subsystems, including motors, actuators, and sensors (Li et al., 2019). Recent numerical analyses have also examined PSD performance under extreme conditions, such as fire scenarios, highlighting the broader safety implications of doorsystem reliability (Teodosiu and Kubinyecz, 2022).
However, most PSD studies are limited to single-line systems, short observation windows, or engineering case studies. They rarely couple empirical failure modeling with simulation-based maintenance strategy evaluation at scale. This creates an opportunity for large-sample evidence and integrated reliability policy analysis across manufacturers and environments.
2. Maintenance Optimization and Life-Cycle Cost Evaluation in Rail Systems
Maintenance strategy evaluation in transport infrastructure increasingly integrates life-cycle cost (LCC) analysis with stochastic simulation to capture uncertainty in component degradation and cost outcomes (Patra, 2009; Praticò and Giunta, 2017). Monte Carlo methods have been applied to compare reactive, preventive, and predictive maintenance strategies in rail subsystems such as traction substations and rolling-stock components (Li et al., 2019; Nia et al., 2023). These studies show that maintenance performance depends on system reliability characteristics, failure criticality, and the penalty structure associated with downtime and safety events (Garner et al., 2021; Andersen and Nielsen, 2025).
Yet relatively few works combine empirical Weibull parameter estimation from operational data with Monte Carlo LCC simulation, particularly for PSDs. This methodological gap limits the ability to quantify trade-offs between cost, availability, and safety under uncertainty. The present study addresses this issue by establishing a unified Weibull-Monte Carlo pipeline for empirical reliability assessment and maintenance policy comparison.
3. Reliability and Maintenance in Autonomous and Demand-Responsive Transit
As autonomous and demand-responsive transit (DRT) services evolve, reliable operation of actuator, perception, and control subsystems has become critical for safety and service continuity (Tischer and Correia, 2022; Caggiani et al., 2023). Kim and Park (2022) and Liu et al. (2023) identify door actuation reliability, sensor integrity, and control-system redundancy as key determinants of fleet availability and passenger safety in automated mobility systems.
Research in urban rail and tram systems offers transferable insights: Tiusanen (2023) compared door-system hazards in manual (GoA1) and unattended (GoA4) operations, demonstrating higher malfunction risk in driverless contexts; Tang et al. (2022) surveyed fully automatic metro (GoA4) developments and underscored the safety-critical role of doors and platform interfaces. Similarly, Wang (2015) designed and validated a fully automatic door system for small autonomous vehicles, while the Pods4Rail (2024) concept required ≈1 million open-close cycles to meet reliability thresholds for unattended service.
Although PSDs operate in fixed environments and DRT vehicles in cycle-driven, dynamic conditions, their underlying reliability dependencies motors, sensors, and electronic control units are functionally similar. Prior work (Meeker and Escobar, 1998; Andersen and Nielsen, 2025) highlights the necessity of converting time- based degradation models into cycle-based reliability frameworks to represent the exposure patterns of autonomous fleets. This research extends PSD findings to propose a transferable methodological foundation for predictive maintenance in autonomous transit, focusing on conceptual adaptation rather than direct parameter substitution.
This research extends PSD findings to propose a transferable methodological foundation for predictive maintenance in autonomous transit, focusing on conceptual adaptation rather than direct parameter substitution.
4. Literature Gap and Contribution Positioning
Across these domains, three gaps persist; First, PSD reliability studies rarely use large multi-line operational datasets that enable component-level and manufacturer-level inference. Second, prior rail maintenance studies seldom deploy integrated Weibull-Monte Carlo frameworks to evaluate strategy trade-offs under uncertainty. Third, although predictive maintenance is increasingly relevant for autonomous fleets, formal methodological bridges between fixed-infrastructure reliability modeling and cycle-based maintenance for DRT remain limited.
This study addresses these gaps by combining large-scale PSD failure data analysis with probabilistic lifecycle-cost simulation and by demonstrating how the same Weibull-Monte Carlo reliability framework can be reformulated for autonomous DRT systems. The contribution lies in providing a unified, data-driven approach for availability enhancement and predictive maintenance planning across both fixed and mobile, fully driverless transit environments.
METHODOLOGY
1. Data
This study analyzes 10,078 platform screen door (PSD) failure records collected by KORAIL between 2019 and 2024 across 18 lines and 279 stations in the Seoul Metropolitan Area. Each record represents a maintenance event at the door-unit level (Line-Station-Platform-Door) and contains detailed attributes on component type, manufacturer, and maintenance action. A detailed description of all dataset variables, including component types, manufacturers, and environmental attributes, is summarized in Table 1.
Table 1.
Description of variables in the PSD dataset
2. Preprocessing and Data Cleaning
Several preprocessing steps were applied to ensure data consistency and reliability:
1)Data integration - Logs from 18 lines were merged using a composite key (Line_ID-Station_ID-Plat form_ID-Door_ID).
2)Label normalization - Component, manufacturer, and repair descriptors were standardized using controlled vocabularies; spelling variants and synonyms (e.g., Stop Switch, Emergency Stop) were unified as Electrical Stop.
3)Environment coding - Stations were categorized as aboveground or underground based on KORAIL infrastructure metadata to test environmental reliability effects.
4)Right-censoring treatment - Units with no recorded failures during the observation window were excluded from lifetime fitting. While this yields conservative reliability estimates, future work may apply right-censored maximum-likelihood estimation (Meeker and Escobar, 1998) to refine results.
5)Computation of MTBF inputs - For each PSD unit u, total operating time () and number of failures() were calculated to obtain preliminary MTBF values before Weibull parameter estimation.
Key descriptive statistics for major analytical variables, such as dominant component types and age distributions, are presented in Table 2, providing an overview of dataset structure.
Table 2.
Key variables and descriptive statistics
3. Reliability
Reliability analysis was conducted using standard and widely validated approaches in engineering research. Temporal analysis was first applied to examine seasonal and cyclical failure distributions, as seasonal effects are known to influence electromechanical systems (Lee et al., 2009). Next, component-level metrics, including Mean Time Between Failures (MTBF), failure rates, and B10 life, were computed. These measures are well-established in reliability engineering, offering interpretable indicators of operational performance (Alshahrani, 2017). MTBF in particular is frequently used in metro system reliability benchmarking (Li et al., 2019). MTBF was computed at the unit level, where each platform screen door (PSD) is defined as a unique Line-Station-Platform-Door combination. For each unit u, MTBF was calculated as:
Where, is the unit’s total operating time and is its observed number of failures.
To model degradation behavior, the Weibull distribution was fitted to component failure intervals. The Weibull model was chosen because of its flexibility in capturing a range of failure modes (infant mortality, random failures, and wear-out) within a single distribution. This makes it particularly suitable for complex multi-component systems such as PSDs, where different parts deteriorate at different rates (Shahriari et al., 2024).
In this study, all maintenance log entries were treated as observed failure events. Units that remained in service without recorded failures during the observation window (2019-2024) were not modeled as right-censored lifetimes. While this approach provides conservative reliability estimates, it may bias MTBF values downward by not accounting for surviving components. Future work could incorporate censored-data methods, such as maximum likelihood estimation with right-censoring (Meeker and Escobar, 1998), to obtain less biased lifetime distributions.
Reliability differences were also compared across manufacturers and environments, as manufacturer variability and ridership intensity are both known drivers of reliability heterogeneity in rail infrastructure (Wang et al., 2024). Component lifetimes were modeled using a two-parameter Weibull distribution, widely applied in reliability engineering due to its ability to represent early-life, random, and wear-out failures within a single framework. The distribution is defined as:
with cumulative distribution F(t), reliability function R(t), and hazard function h(t) given by:
Here, β is the shape parameter and η is the scale parameter. Interpretation of β provides insights into the underlying failure mechanism: β<1 indicates decreasing hazard (infant mortality), β=1 indicates constant hazard (random failures), and β>1 indicates increasing hazard (wear-out failures).
4. Maintenance Strategy Simulation
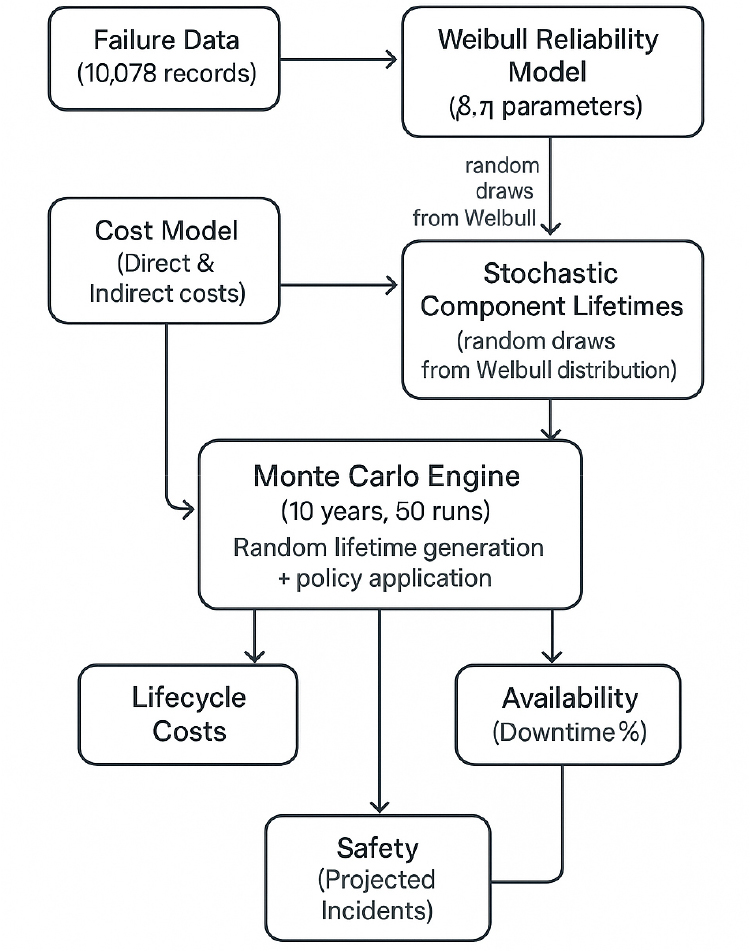
To evaluate the practical implications of alternative maintenance strategies, a Monte Carlo simulation framework was developed. Monte Carlo methods were selected because they allow for explicit modeling of stochastic degradation, uncertainty in failure times, and variability in costs, which are analytically intractable using closed-form approaches (Vandoorne, 2018; Garner et al., 2021). This approach is consistent with international best practice in railway asset management, where simulation under uncertainty is the preferred method for maintenance strategy evaluation (Nia et al., 2023). Four strategies were modeled: reactive maintenance (replacement upon failure), preventive maintenance (fixed-interval replacement), condition-based maintenance (age-threshold replacement), and predictive maintenance (replacement triggered when reliability falls below a set threshold). These strategies represent the main categories of maintenance policies identified in both research and practice (Swanson, 2001). The overall Monte Carlo workflow used to evaluate the four maintenance strategies is illustrated in Figure 1, which outlines lifetime generation, intervention logic, and cost accumulation.The overall Monte Carlo workflow used to evaluate the four maintenance strategies is illustrated in Figure 1, which outlines lifetime generation, intervention logic, and cost accumulation.
These strategies were selected because they represent the primary categories of maintenance policies recognized in both practice and research (Swanson, 2001). Modeling all four provides a comprehensive comparison for operators considering a shift away from traditional preventive strategies. Simulation lifetimes were generated using Weibull parameters estimated from the dataset (β ranging from 1.63 to 2.30). The use of Weibull-derived lifetimes ensures consistency between empirical reliability analysis and policy evaluation. Each strategy was simulated over a 10-year horizon, with 50 independent runs to ensure stability of results.
5. Cost Modeling Specification
Because operator-specific cost data were proprietary, a structured benchmark-based cost model was developed to enable comparative lifecycle evaluation among maintenance strategies. This approach follows previous studies that have demonstrated that relative cost comparisons remain valid when base values are standardized and consistently applied across strategies (Patra, 2009; Praticò and Giunta, 2017; Garner et al., 2021).
The total maintenance cost (C_total) for each simulation run was calculated as the sum of direct and indirect cost components:
1) Cost structure logic
Reactive maintenance (RM) assumes replacement only after failure, resulting in high unplanned labor and downtime penalties.
Preventive maintenance (PM) replaces components at fixed intervals regardless of condition, generating high direct costs due to premature replacements but minimal downtime
Condition-based maintenance (CBM) triggers intervention when component age exceeds an optimal threshold (), reducing unnecessary replacements while preventing major downtime.
Predictive maintenance (PdM) employs reliability thresholds () derived from Weibull parameters; earlier interventions reduce failure risk and safety penalties but increase monitoring and sensor costs.
The specific cost components and parameter values used in the simulation are summarized in Table 3. All cost parameters were expressed in 2024 U.S. dollars and treated as stochastic variables within the Monte Carlo simulation, sampled from normal distributions with standard deviation to reflect economic uncertainty. Costs were aggregated over a 10-year simulation horizon to estimate total lifecycle expenditure per strategy.
Table 3.
Cost model components and assumptions
| Category | Cost element | Description | Parameter/value | Source/logic |
| Direct costs | Base maintenance cost | Material and labor cost per intervention | Planned: $100/event | Benchmark from metro PSD maintenance contracts (Patra, 2009) |
| Unplanned: $300/event | ||||
| Indirect costs | Downtime penalty | Lost service availability valued per hour | $200/hour | Modeled on Seoul Metro average per platform-door-hour |
| Safety incident penalty | Severe failure events with passenger impact | $10,000 per incident | Based on risk-weighted safety cost (Garner et al., 2021) | |
| Total cost per strategy |
Sum over simulation horizon (10 years x 50 runs) |
Condition-based ≈ $7.9M; Predictive ≈ $9.0M; Preventive ≈ $10.0M; Reactive ≈ $8.6M |
2) Assumption validity and limitations
While absolute cost magnitudes are illustrative, the relative cost rankings among strategies remain robust to moderate changes (±20%) in any parameter. This structure also permits sensitivity testing on downtime valuation and safety penalties, as discussed in Section 3.6. Future work may incorporate operator-supplied accounting data to calibrate cost coefficients and improve external validity.
6. Sensitivity Analysis
To identify optimal maintenance parameters, a sensitivity analysis was conducted across a realistic range of intervals and thresholds. Preventive maintenance intervals were varied between 545 and 2,555 days, reflecting common multi-year maintenance cycles in metro systems. This range spans short-cycle interventions (~1.5 years) through extended long-cycle regimes (~7 years), consistent with international railway studies that apply multi-year horizons for robustness testing (Patra, 2009; Andersen and Nielsen, 2025).
Condition-based thresholds were tested over the same range, while predictive strategies were evaluated using reliability thresholds between 0.5 and 0.9. These values represent conservative (R=0.9) versus risk-tolerant (R=0.5) replacement strategies, consistent with predictive maintenance evaluations in industrial and metro systems that commonly use thresholds in the 0.6-0.9 range (Garner et al., 2021; Nia et al., 2023). These ranges were selected to capture both conservative and aggressive maintenance regimes, in line with practices reported in infrastructure maintenance research (Garner et al., 2021; Swanson, 2001). Outcomes were compared on three criteria: cost, availability, and safety. A composite performance index was used to evaluate trade-offs, with weights of 40% for cost, 30% for availability, and 30% for safety. This weighting scheme follows the RAMS-LCC framework, which emphasizes lifecycle cost efficiency while balancing service continuity and safety as secondary but essential concerns (Praticò and Giunta, 2017; Swanson, 2001). These weights reflect the practical priorities of metro operators, who must simultaneously minimize expenditure, maintain service continuity, and safeguard passengers.
RESULTS
1. Failure Pattern Analysis
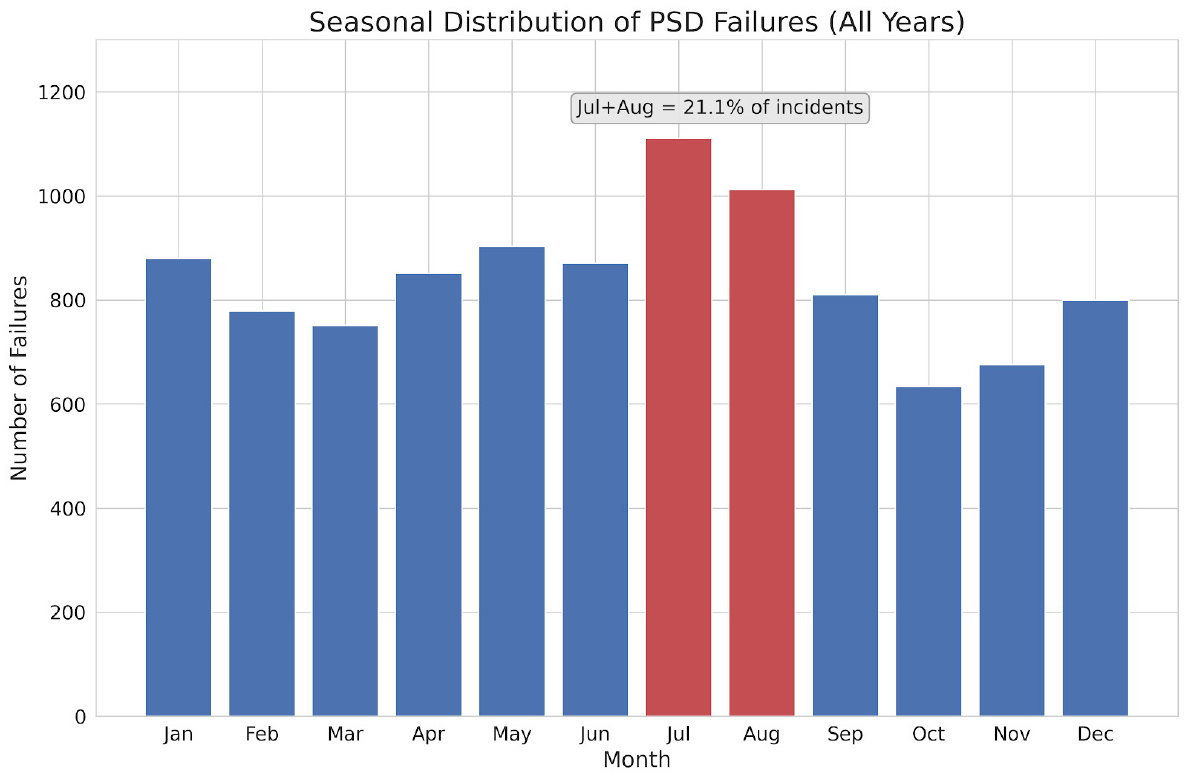
The temporal analysis revealed clear seasonal variation in PSD failures. Seasonal variability in PSD failure patterns is shown in Figure 2, highlighting a clear concentration of failures during the summer months. Failures peaked during July and August, which together accounted for 21% of incidents in Figure 4. This pattern suggests that higher temperatures, humidity, and passenger volumes in summer exert additional stress on electromechanical components. These findings are consistent with studies on environmental effects in subway environments, which highlight heat and ventilation as critical reliability factors (Lee et al., 2009).
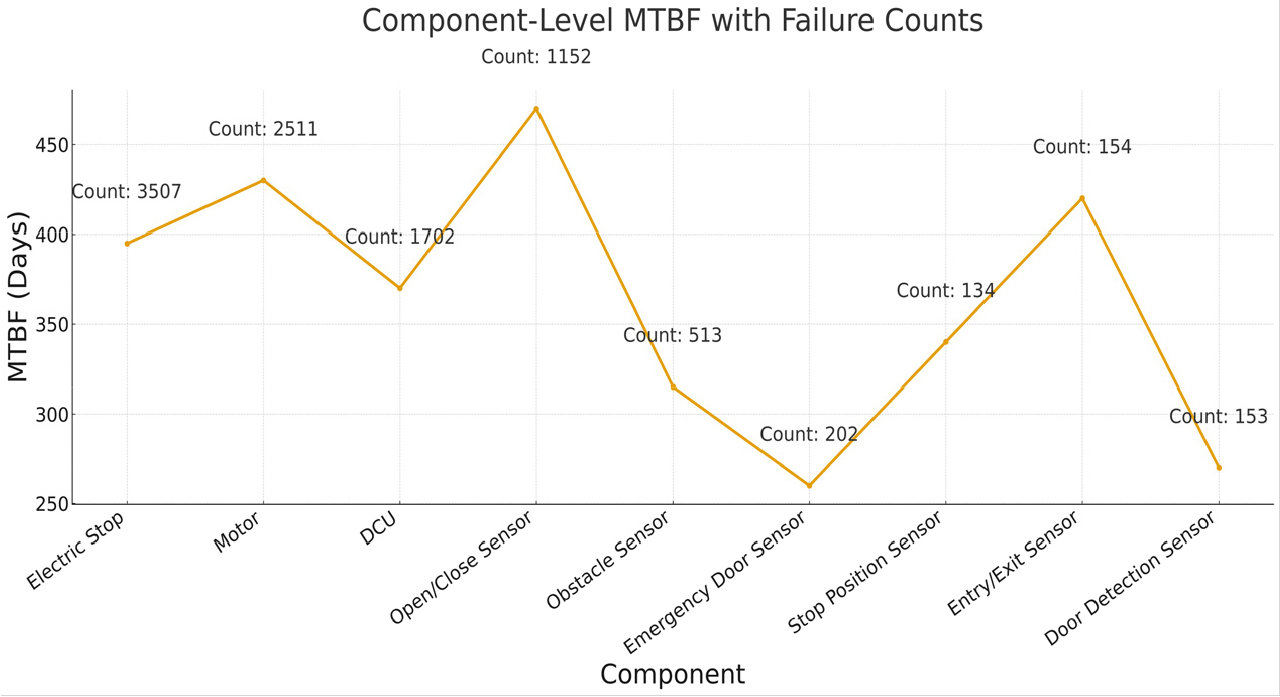
At the component level, electrical stops and motors emerged as the most failure-prone elements, representing 34.8% (3,507) and 24.9% (2,511) of total failures, respectively. The MTBF varied considerably across components, from 263 days for Door Detection Sensors to 470 days for Open/close sensors in Figure 3.
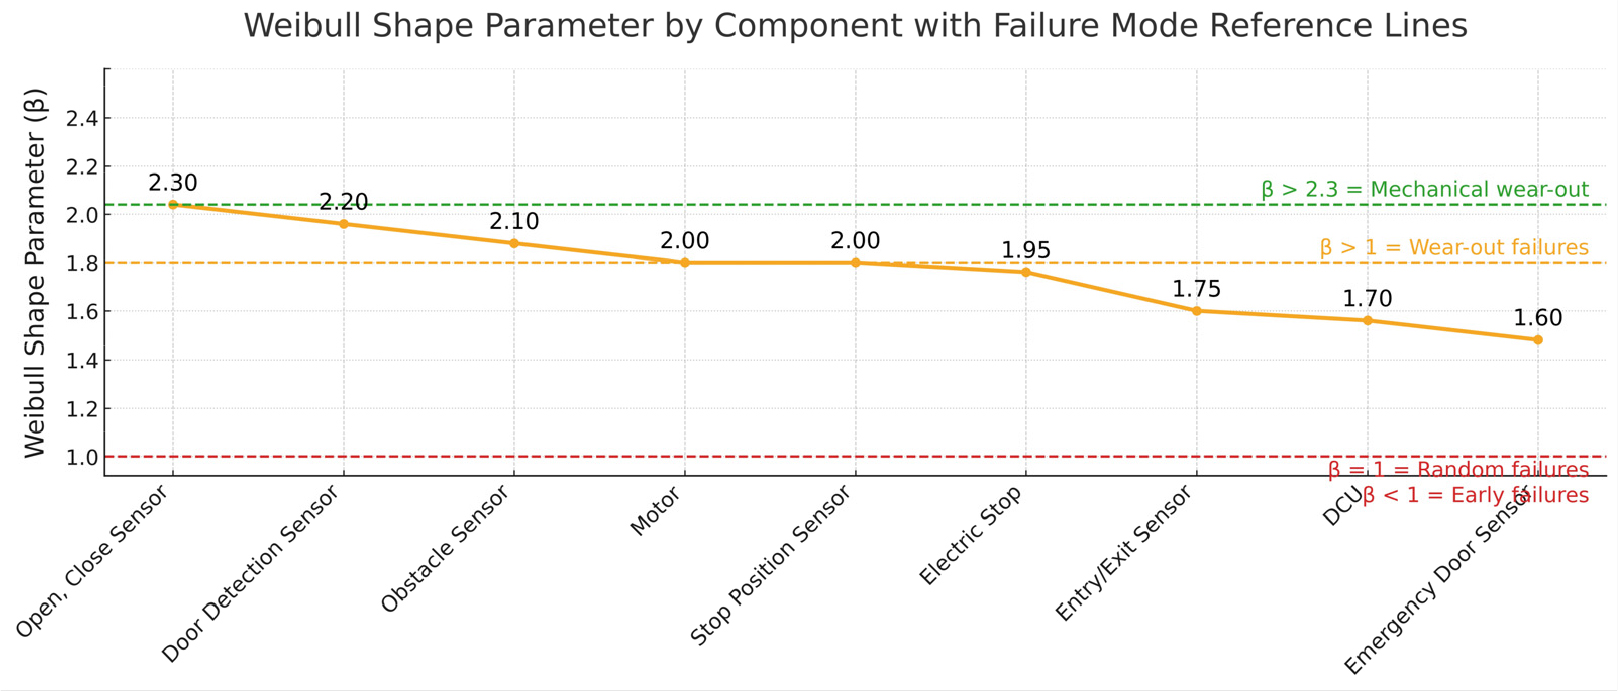
Weibull analysis shows that all PSD components exhibit wear-out failure modes (β = 1.63-2.30) in Figure 4, demonstrating that most PSD components follow wear-out failure modes rather than random failures. This validates the use of age-based or condition-based maintenance are more effective than run-to-failure approaches.
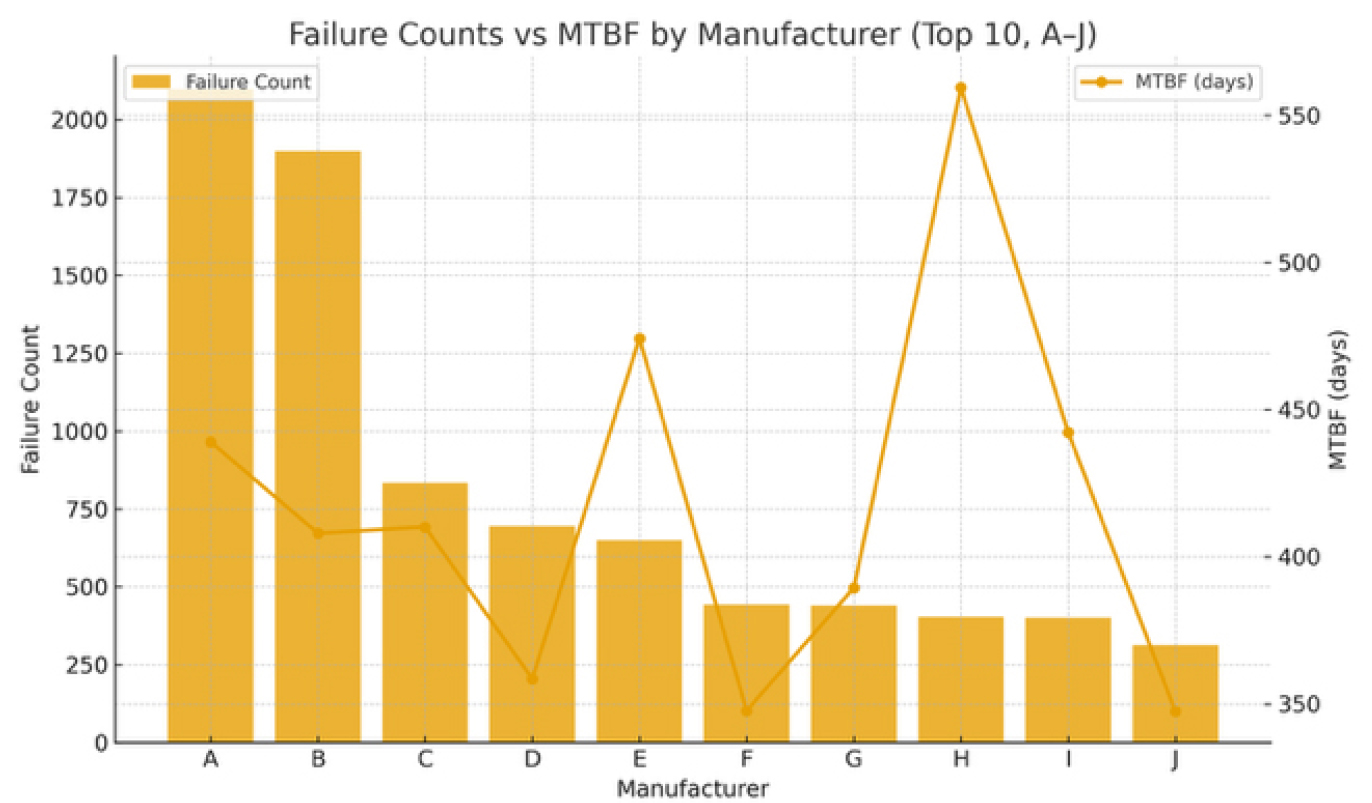
Manufacturer-level analysis further showed large performance differences in Figure 5. The most reliable manufacturer achieved an MTBF of 559 days, while the least reliable manufacturer achieved an MTBF of 347 days. This suggests that procurement choices and manufacturer differentiation may significantly affect lifecycle maintenance costs. In other words the significant variations in reliability among manufacturers indicate the need for harmonized strategies to raise the overall performance level.
2. Maintenance Strategy Simulation
The Monte Carlo simulations demonstrated clear trade-offs among the four maintenance strategies. In terms of cost, condition-based maintenance was the most efficient, with an average ten-year expenditure of $7.92 million. Predictive maintenance followed at $8.98 million, while reactive and preventive approaches were more expensive at $8.57 million and $10.02 million, respectively in Figure 6.
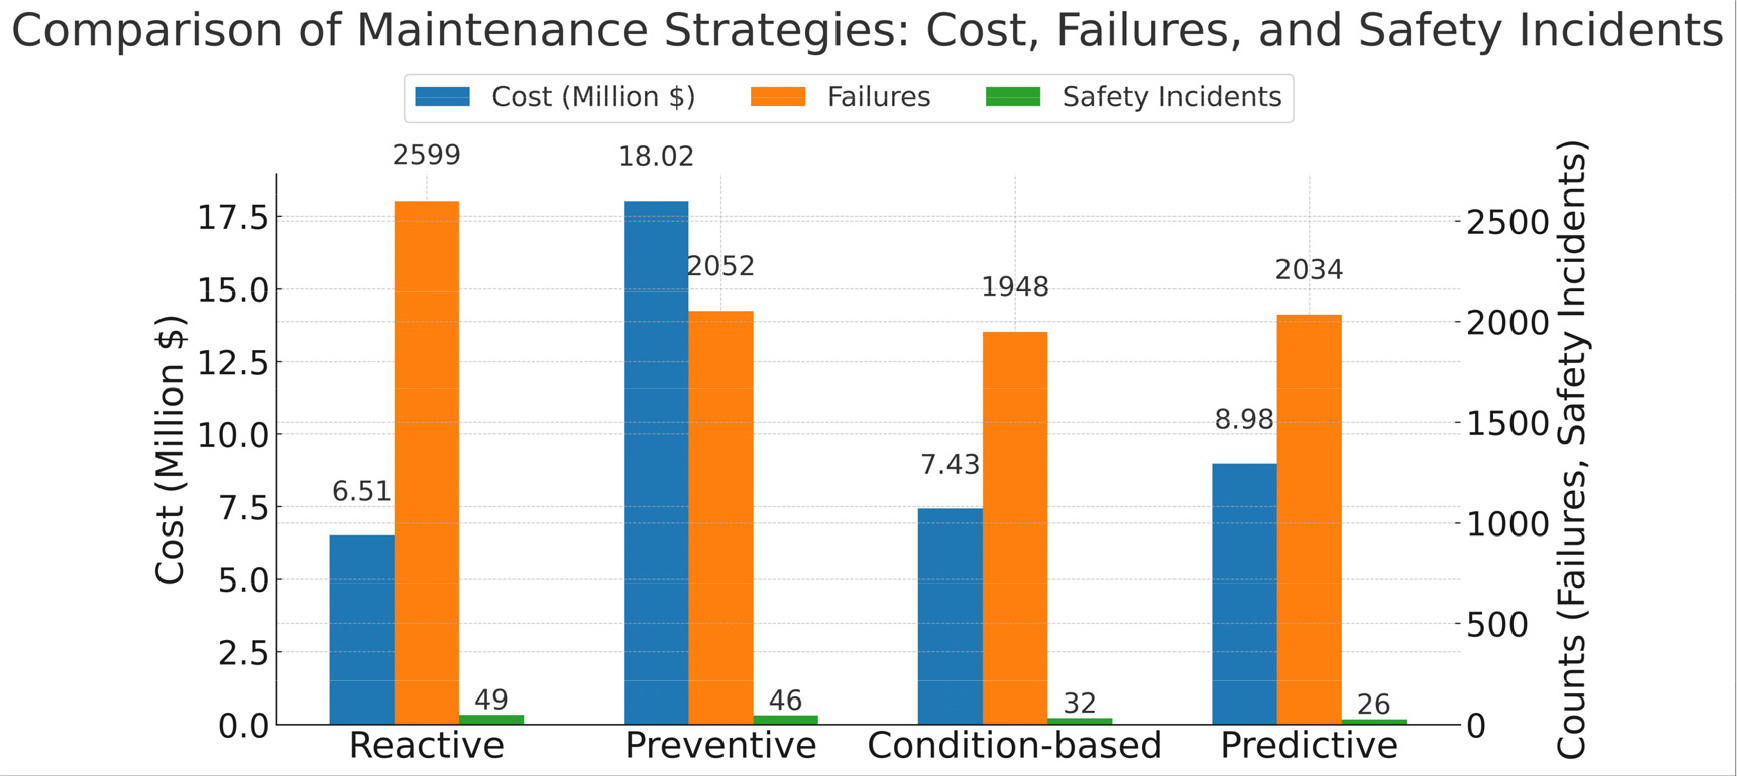
The relatively high cost of preventive maintenance was driven by premature component replacements, while reactive maintenance incurred higher downtime and indirect costs. Reliability outcomes highlighted the advantages of predictive maintenance. Across the ten-year horizon, predictive policies resulted in 1,084 failures, compared with 1,540 under condition-based, 2,062 under preventive, and 2,699 under reactive maintenance. Safety outcomes followed a similar trend, with predictive maintenance producing the fewest projected incidents (24), followed by condition-based (32), preventive (44), and reactive (49). These results demonstrate that predictive strategies, while moderately more expensive than condition-based, provide superior risk reduction.
These findings align with Garner et al.(2021), who argue that predictive maintenance delivers long-term benefits when degradation can be reliably monitored. However, they also caution that the benefits depend on the accuracy of condition monitoring systems, a limitation discussed further in Duscussion.
3. Sensitivity Analysis and Optimization
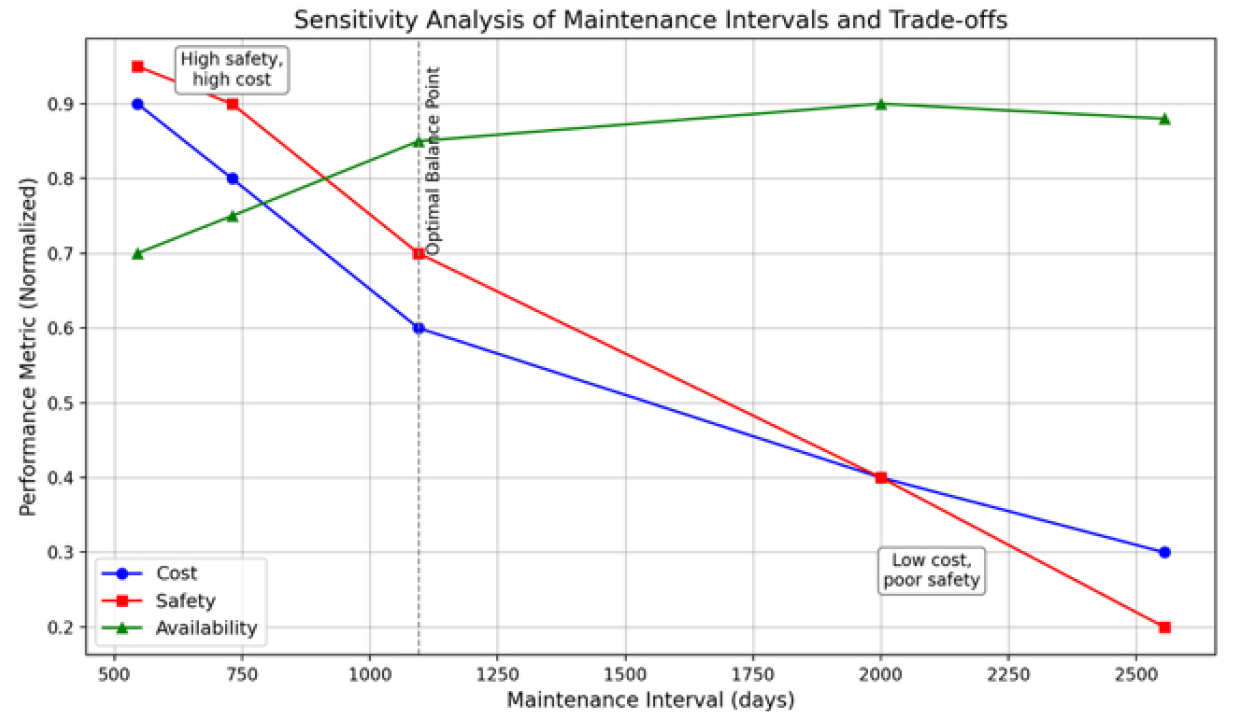
Figure 7 presents the outcomes of the sensitivity analysis across preventive, condition-based, and predictive strategies, illustrating the trade-offs between cost, safety, and availability. For condition-based maintenance, shorter intervals around 730 days yielded the lowest number of failures and highest safety levels, but lifecycle costs rose sharply due to premature replacements. In contrast, longer intervals exceeding 2,000 days reduced costs but resulted in higher incident risk and reduced availability. As shown in Figure X, the cost, safety, and availability curves converge near 1,095 days, indicating this as the optimal balance point between financial efficiency and passenger safety.
For predictive strategies, reliability thresholds between R(t)=0.5 and 0.9 produced distinct outcomes. The most balanced performance occurred at R(t)=0.70, where safety risks were controlled without excessive premature replacement costs. More conservative thresholds (R=0.90) improved safety further but significantly increased costs, while lower thresholds (R=0.50) allowed unacceptable failure levels.
At the component level, electrical stops and motors consistently required more aggressive cycles, reflecting their high wear-out profiles, while controllers and sensors demonstrated sufficient durability to operate on extended intervals without compromising availability. These results underscore the importance of tailoring maintenance intervals to component-specific risk profiles rather than applying uniform cycles.
DISCUSSION
1. Reliability Insights
The reliability analysis confirms that PSD failures in Seoul Metropolitan Area are primarily governed by wear-out mechanisms, as shown by Weibull parameters greater than one. This finding validates the adoption of proactive maintenance approaches, since failure risk accelerates with component age rather than occurring randomly.
2. Policy Trade-offs and Managerial Interpretation
Simulation results reveal a clear trade-off between lifecycle cost and reliability. Condition-based maintenance (CBM) achieved the lowest cost, while predictive maintenance (PdM) yielded superior safety and reliability outcomes. These patterns are consistent with prior findings on predictive strategies (Garner et al., 2021; Nia et al., 2023) yet provide new evidence for PSD systems, which have rarely been evaluated using large-scale field data.
From a managerial perspective, a hybrid strategy is recommended: predictive thresholds for high-risk components (motors, electrical stops) and condition-based cycles for low-risk parts. This balance minimizes life cycle cost while sustaining service safety addressing the limitations of fixed-interval preventive maintenance (Swanson, 2001).
3. Methodological Limitations
Two main limitations should be acknowledged. First, the cost framework relied on benchmark assumptions rather than proprietary operator data, making absolute cost values indicative rather than definitive. Second, predictive performance assumes accurate sensor diagnostics; real-world signal noise and false-alarm rates may alter effectiveness. Future work should integrate operator accounting data and real monitoring performance to strengthen external validity.
4. Implications for Demand-Responsive Transit (DRT)
Although PSDs are stationary assets and DRT fleets operate in dynamic, mobile contexts, their safety-critical electromechanical subsystems, door actuators, latch sensors, and drive control units, exhibit comparable degradation behavior and reliability dependencies. The essential distinction lies in exposure measurement: for PSDs it accrues in calendar time; for DRT vehicles, it accrues in door-operation cycles per stop. Thus, the validated Weibull-Monte Carlo framework can be reformulated for DRT by expressing the scale parameter in cycles and adapting the cost structure to include missed-pickup and availability penalties.
The same maintenance logic (reactive, time-based, CBM, PdM) remains applicable, enabling reliability- based fleet scheduling and predictive cost optimization. A concise implementation blueprint is provided in Appendix A. This methodological bridge demonstrates how PSD reliability research can inform predictive maintenance architecturesfor autonomous and on-demand transit, ensuring consistent safety assurance across both infrastructure and vehicle domains.
CONCLUSION
This study analyzed the reliability and maintenance of platform screen doors (PSDs) in the Seoul Metropolitan Area Railway system using over 10,000 recorded failures. Weibull-based reliability modeling and Monte Carlo life-cycle simulations were applied to evaluate reactive, preventive, condition-based and predictive maintenance strategies in terms of cost, reliability, and safety.
Results show that condition-based maintenance provides the most cost-efficient policy, while predictive maintenance yields the highest safety and reliability performance consistent with findings by Garner et al. (2021) and Nia et al. (2023). Preventive maintenance, although common practice, proved inefficient under wear-out failure conditions, echoing long-standing critiques of fixed-interval policies (Swanson, 2001). Significant variation among manufacturers and operational environments highlights the need for supplier-specific and season-sensitive maintenance planning. A hybrid framework, predictive thresholds for high-risk components (motors, electrical stops) and condition-based cycles for lower-risk parts therefore offers the best balance of cost, safety, and availability, in line with comparative results reported by Andersen and Nielsen (2025).
The cost model relied on structured benchmark assumptions and idealized monitoring accuracy; incorporating operator-specific accounting data and real-world diagnostic precision will strengthen future evaluations.
Beyond metro infrastructure, the proposed Weibull-Monte Carlo maintenance framework can be reformulated for autonomous and demand-responsive transit (DRT) subsystems that share similar electromechanical reliability dependencies. By expressing exposure in cycles rather than calendar time and adapting penalty terms for fleet service continuity, the framework provides a transferable basis for predictive maintenance in autonomous shuttles and on-demand fleets (Caggiani et al., 2023; Tischer and Correia, 2022).
Future research should explore vehicle-to-infrastructure (V2I) diagnostic loops linking PSDs and driverless vehicles to enable real-time predictive maintenance and support Safety Integrity Level 3 (SIL3) certification within next-generation transit systems.
