


INTRODUCTION
DATA SOURCES AND PREPROCESSING
METHODS
1. Data Warehouse and Star Schema Data Cube
2. Concept Hierarchies and OLAP Operations
3. Scenario-Specific Validation Procedures
RESULTS AND DISCUSSION
1. Case Study Context and Analytical Scenarios
2. Scenario I. Organization and Driver Level Heterogeneity in Risky Driving
3. Scenario II. Spatiotemporal Patterns of Risky Driving in Urban Areas
4. Discussion
CONCLUSIONS
INTRODUCTION
Road traffic crashes remain a substantial global public health and transport safety burden, causing approximately 1.19 million deaths and 20–50 million nonfatal injuries each year and generating economic losses equivalent to roughly 3% of gross domestic product in many countries (World Health Organization, 2023). Within this broader burden, crashes involving commercial vehicles warrant particular attention because buses, taxis, and freight vehicles combine high operational intensity with large vehicle mass, thereby amplifying both injury severity and wider social and economic consequences (Pahukula et al., 2015; Nævestad et al., 2023). This concern is also evident in South Korea, where business vehicles accounted for approximately one fifth of all road crashes and road fatalities in 2024 (KoROAD Traffic Accident Analysis System (TAAS), 2026a, 2026b). These patterns underscore the need for more robust evidence-based strategies for commercial vehicle crash prevention in South Korea.
In South Korea, one of the principal institutional instruments for commercial vehicle safety management is the digital tachograph (DTG). DTG devices record second-level vehicle operation data and enable the extraction of 11 nationally standardized risky-driving event categories used for regulatory monitoring and safety education, including overspeeding, prolonged speeding, harsh acceleration, harsh braking, rapid start, abrupt stop, sharp left turn, sharp right turn, sharp U-turn, abrupt overtaking, and abrupt lane change (Korea Transportation Safety Authority, 2023). Their importance lies in their integration into the regulatory workflow. Nevertheless, current management remains largely grounded in simple event counts and standardized follow-up measures. This count-based logic is limited because accident indicators, DTG statistics, company registries, and driver registries are maintained across multiple administrative dimensions, but have not been organized into an integrated analytical framework for interpreting the 11 risky-driving categories (Ministry of Land, Infrastructure and Transport, 2025a, 2025b; Korea Transportation Safety Authority, 2026a, 2026b).
This limitation points to a broader analytical issue: event frequencies alone are insufficient to characterize the context, operating conditions, and managerial priority of risky driving. Similar event counts may indicate different safety-management problems when they are concentrated in different company types, driver groups, service areas, or time periods. Prior studies have shown that risky driving varies across organizational characteristics, driver characteristics, time of operation, and spatial context (Wang et al., 2018; Feng et al., 2016). Recent driving-behavior, DTG, and telematics studies have also shown that risky-driving patterns can be analyzed through vehicle telemetry, contextual data, clustering, hotspot identification, prediction, and explainable modeling approaches (Du et al., 2023; Zhou and Zhang, 2019; Cho et al., 2023b; Jin and Noh, 2023; Masello et al., 2023; Boylan et al., 2024; Ziakopoulos, 2024). However, much of this literature remains oriented toward event detection, prediction, or predefined modeling targets. As a result, limited practical analytical support is available for comparing and interpreting the 11 standardized DTG indicators across companies, drivers, locations, and time windows within regulatory practice.
Commercial-fleet safety management also requires company-level oversight because transportation companies are expected to monitor risky-driving behavior, driver fatigue, work pressure, and heterogeneous route environments (Knipling et al., 2003; Kim et al., 2018; Han and Lee, 2020; Han et al., 2023). However, institutional monitoring and safety-education systems often rely on standardized programs and broad company classifications, which may not fully reflect heterogeneity in company scale, fleet composition, driver experience, or spatiotemporal operating conditions (Cho et al., 2023a; Lee et al., 2020). This reinforces the need for a decision-support workflow that links standardized DTG event indicators with company, driver, spatial, temporal, and accident contexts.
The gap is therefore not a shortage of DTG indicators or machine-learning models, but the absence of an analytical workflow that (i) connects nationally standardized risky-driving indicators to company, driver, spatial, temporal, and accident information, (ii) does so at management-relevant aggregation levels, and (iii) examines whether event-burden patterns identified from DTG data are associated with accident outcomes after considering the available exposure information. A previous Korean DTG data-cube study demonstrated that the 11 standardized risky-driving indicators can be organized across company, driver, time, space, and accident dimensions using a multidimensional data structure (Jin et al., 2024). Building on that foundation, the present study shifts the focus from data-cube construction and online analytical processing (OLAP)-based description to accident linkage, exposure sensitivity, and post-OLAP statistical validation. A star schema data cube is retained as the integration structure, and staged OLAP is used as a decision-support scaffold—not the end-product—to progressively narrow management priorities across company type, fleet size, driver career structure, location, and time. Post-OLAP statistical validation then examines whether the narrowed priorities are supported in organization-level event-burden models and in exposure-adjusted accident-count models at the neighborhood×time-bin level.
This study makes three contributions. First, it extends the multidimensional DTG data-cube approach toward accident-informed safety management by integrating nationally standardized risky-driving events with accident, company, driver, spatial, and temporal attributes. In this framework, staged OLAP exploration is used to identify management-relevant event-burden patterns across company type, fleet size, driver career structure, location, and time, rather than to propose a new OLAP method. Second, it adds post-OLAP statistical validation by applying ordinary least squares (OLS) to organization-level event-burden patterns and negative-binomial generalized linear models (NB GLM) to neighborhood×time-bin accident counts with trip exposure. Third, it compares harsh acceleration, harsh braking, and speeding to examine whether standardized DTG categories show different organizational signatures and accident-linkage profiles. These contributions support differentiated, association-based commercial vehicle safety management that distinguishes event-burden hotspots from exposure-adjusted accident-count correlates.
The remainder of this paper is organized as follows. The next section describes the data sources and preprocessing procedures. The Methods section then explains the data-cube construction, concept hierarchies, OLAP workflow, and scenario-specific validation procedures. The Results and Discussion section presents two scenario-based analyses of organization-level and spatiotemporal heterogeneity, followed by the Conclusions section.
DATA SOURCES AND PREPROCESSING
The analytical dataset was created by integrating four source systems: DTG-derived risky-driving events, police-reported traffic-accident records, transportation-company information, and commercial-driver profiles. The integration procedure followed an extract-transform-load (ETL) workflow in which timestamps, spatial identifiers, company codes, and categorical attributes were standardized before the records were loaded into the warehouse. During this process, the source tables were screened for linkage completeness, anonymized identifiers were synchronized across datasets, and the variables required for the concept hierarchies were harmonized into consistent analytical categories. The case study focused on Daejeon, and the main multidimensional analyses were conducted for 2019 because that year represented the local peak in accident occurrence within the study period.
DTG-derived risky-driving events The primary dataset comprised records of 11 risky-driving event categories extracted from DTG data. In South Korea, commercial vehicles are required to be equipped with onboard units that collect second-level operational data managed by the Korea Transportation Safety Authority. The DTG records include timestamps, vehicle and company identifiers, speed, acceleration, braking signals, mileage, and GPS-based location information. The official event categories include overspeeding, prolonged speeding, harsh acceleration, harsh braking, rapid start, abrupt stop, sharp left turn, sharp right turn, sharp U-turn, abrupt overtaking, and abrupt lane change (Korea Transportation Safety Authority, 2023). In the remainder of this paper, these road-safety terms are used when referring to the corresponding official DTG event categories. Table 1 summarizes the official extraction rules used to identify the 11 risky-driving categories.
Table 1.
Official classification and extraction criteria for the 11 DTG risky-driving event categories
Traffic-accident records To complement the event-based analysis, police-reported road traffic accident records provided by the Korean National Police Agency were incorporated (Korea National Police Agency, 2023). The accident records included accident time, location, severity, involved vehicle types, road and weather conditions, and driver-related attributes required for linkage and aggregation. By aligning accident time and location with DTG-derived risky-driving events, the integrated warehouse supported exploratory comparison between the distribution of risky-driving events and accident outcomes.
Transportation-company information and driver profiles Company and driver data were obtained from the Korea Transportation Safety Authority and related administrative sources. Company-level attributes included fleet size, operational type, and related identifiers required for warehouse integration. Driver-level attributes included demographic characteristics, total commercial-driving career, company tenure, and administrative safety-history variables. These datasets were transformed into categorical levels suitable for concept hierarchies, such as company-scale groups and age- or experience-based driver groupings. Because these variables served mainly as linkage keys and hierarchy-defining attributes, the detailed field dictionary is not reproduced in the main text.
Integration for multidimensional analysis The integrated warehouse linked risky-driving events to companies, driver groups, times, locations, and accident contexts. Company codes associated DTG records with transportation-company information, while harmonized temporal and spatial attributes supported matching with accident records and administrative-area hierarchies. This structure allowed OLAP queries to reflect not only event frequency but also the surrounding operational and safety context.
Analytic cohort for the Daejeon 2019 case study After ETL and record linkage, the analytic cohort comprised approximately 80 million DTG-derived risky-driving events distributed across the 11 standardized categories, 247 commercial transportation companies spanning Local/Route Bus, Charter/Tour Bus, Taxi, and Freight, and 6,814 commercial drivers. Each company was assigned to one of five fleet-size groups (G1–G5) using regulator-defined cut-offs, and each driver was mapped to career and age strata consistent with the concept hierarchies. Accident records with complete time and location fields were linked to risky-driving events and to the company registry through vehicle identifiers, timestamps, and dong-level spatial keys; records with missing company code, missing hour, or invalid dong were excluded before aggregation. For Scenario II, these records were aggregated into dong×time-bin cells using five time bins (AM peak, PM peak, evening, night, daytime), producing the analytical grid on which the NB GLM was estimated. Extreme values in events per vehicle (EPV), accidents per vehicle, and freight-event share were examined through outlier diagnostics and winsorization-based sensitivity checks.
METHODS
The analytical architecture comprised three components: data warehousing and star-schema data cube construction, concept hierarchies and staged OLAP exploration, and scenario-specific statistical validation. The objective was to support interpretable multidimensional exploration of DTG risky-driving event burdens and to examine whether OLAP-selected patterns were consistent with accident, exposure, and organizational evidence.
1. Data Warehouse and Star Schema Data Cube
Prior to constructing the data cube, the integrated source datasets were loaded into a warehouse through ETL procedures that standardized the linkage keys, time variables, spatial units, and categorical attributes required for multidimensional analysis. The warehouse was then organized as a star schema, which separates descriptive dimensions from the fact table and thereby supports consistent aggregation across management-relevant dimensions (Han et al., 2022; Kim et al., 2022). Figure 1 presents the resulting schema.
Operationally, standardized keys for time, location, company, driver, and accident attributes were assigned to each DTG-derived event record. Event counts were stored in the fact table, while dimension tables retained the categorical attributes needed for roll-up, drill-down, slice, and dice operations.
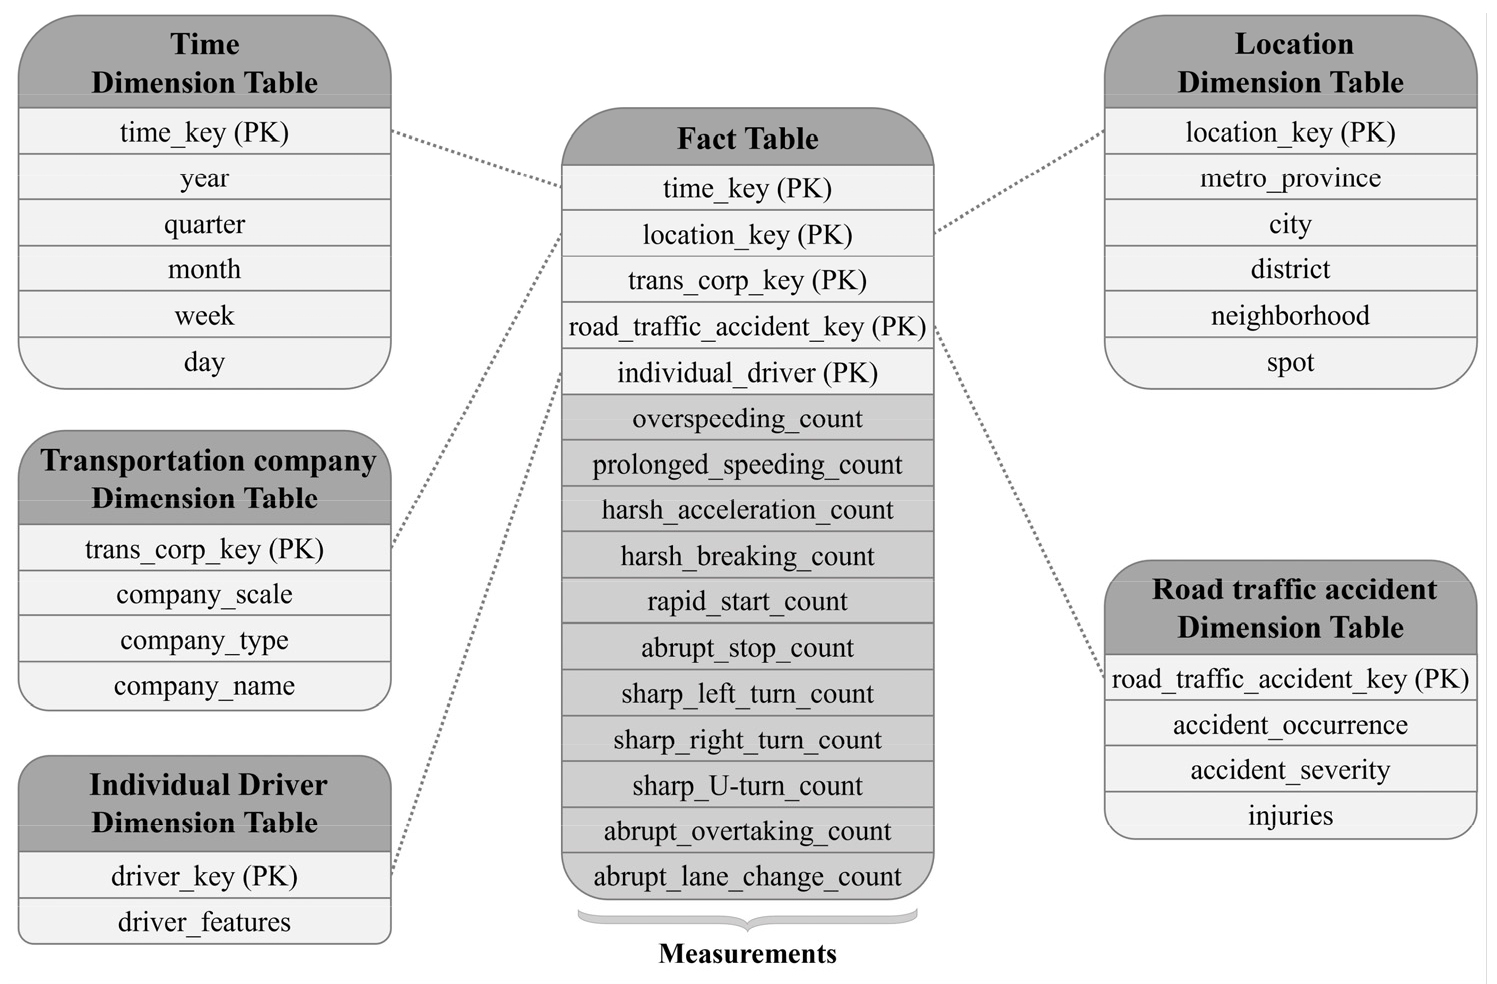
Five major dimensions were defined: time, location, company, driver, and traffic accident. The company dimension represents company scale and operational type, the driver dimension captures demographic and experience-related characteristics, the time dimension supports temporal aggregation, the location dimension links events to administrative areas, and the accident dimension provides crash-related context. This design allows the same risky-driving events to be examined from multiple management-relevant perspectives without duplicating the event records themselves.
2. Concept Hierarchies and OLAP Operations
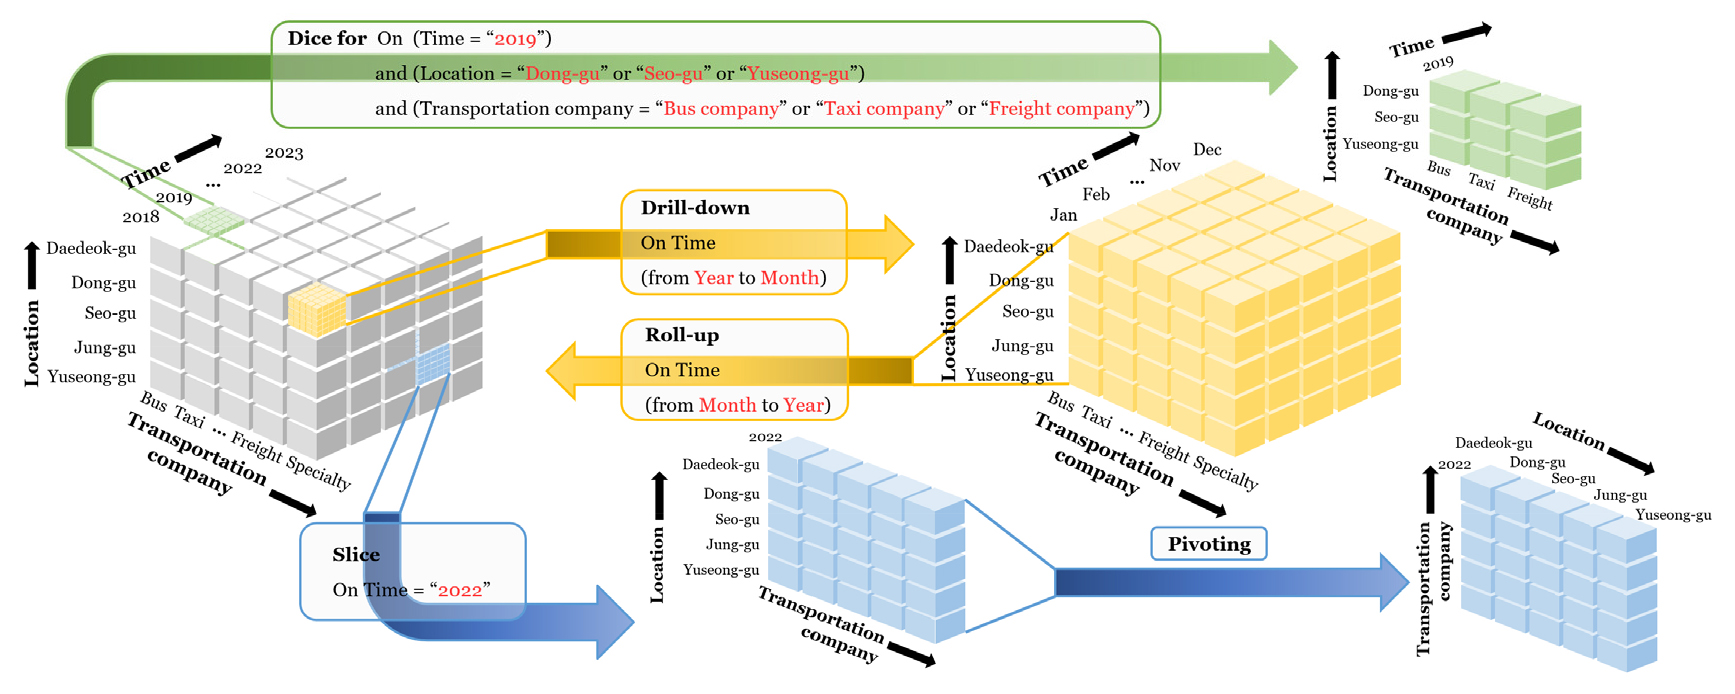
To support analysis at multiple levels of abstraction, concept hierarchies were defined for the core dimensions. A concept hierarchy represents ordered mappings from detailed categories to progressively more general categories, thereby enabling systematic movement between granular and aggregated views. In this study, company records were grouped by company subtype, company type, and fleet-size group; time was organized as day < {month < quarter; week} < year; location moved from dong to gu and city; and driver- and accident-related attributes were grouped into age/career and crash-context levels. These hierarchies were implemented through OLAP operations, allowing the analyst to move from broad summaries to detailed operational views while preserving the underlying dimensional logic (Noh et al., 2022; Noh and Yeo, 2021).
The principal OLAP operations were roll-up, drill-down, slice, dice, and pivot. Roll-up and drill-down adjust aggregation levels, while slice, dice, and pivot define or rearrange sub-cubes for comparison across dimensions. Figure 2 illustrates their organization into the staged OLAP workflow. The workflow was used for analyst-guided decision support rather than proposed as a new analytical method.
3. Scenario-Specific Validation Procedures
To complement OLAP-based exploration, two validation procedures were aligned with the scenario objectives. For Scenario I, an OLS regression was fitted at the company level among Local/Route Bus operators, using harsh-acceleration EPV, defined as for company , where is the 2019 event count and is the registered fleet size, as the dependent variable, and workforce-composition indicators as independent variables: the proportion of long-career drivers (total commercial-driving career > 11 years), average total career (expressed in years throughout the paper), the proportion of senior drivers (age ≥ 60), and accidents per vehicle. For Scenario II, an NB GLM was fitted at the dong×time-bin level, with accident counts as the dependent variable, trip exposure (log trips) as the offset, and harsh-acceleration EPV, freight-event share, urban-core indicator, and time-period indicators as covariates. The urban-core indicator was defined as seven Seo-gu dong identified through spatial roll-up (Dunsan-1/2-dong, Wolpyeong-1/2/3-dong, Gwanjeo-1/2-dong). Because vehicle-kilometers-traveled (VKT) are not consistently available at the company level, EPV in Scenario I normalizes by fleet size rather than by distance-based exposure; this limitation is revisited in the Discussion.
A layered diagnostic protocol was adopted to assess distributional and inferential assumptions. For the OLS specification, multicollinearity was screened using variance inflation factors (VIF; retention threshold VIF < 5), and heteroskedasticity was addressed through HC3 robust standard errors. Residual behavior was assessed using the Shapiro–Wilk test for normality, the Breusch–Pagan test for heteroskedasticity, the Jarque–Bera test for the joint third- and fourth-moment departure, and Cook's distance for influential observations.
For the NB GLM specification, the choice of a negative-binomial rather than Poisson model was justified by a likelihood-ratio test against a Poisson submodel and by reporting the dispersion parameter with its 95% confidence interval. Incidence-rate ratios (IRRs) with 95% confidence intervals were reported for each covariate, and pseudo- measures (McFadden, Cragg–Uhler, Nagelkerke) were computed as complementary goodness-of-fit indicators. To detect residual spatial structure, global Moran’s I was computed on Pearson residuals aggregated to dong centroids using k-nearest-neighbor (, row-standardized) and inverse-distance weights, with significance assessed by 999 random permutations (seed 42). When residual autocorrelation was detected, the NB GLM was re-run with a spatial-lag covariate (row-standardized neighbor average of the log accident rate), and changes in model fit and dispersion were summarized in the results. Extreme-value influence was assessed by winsorizing the top and bottom 1% of EPV and freight-event share and comparing the results with the unwinsorized specification. Group-level non-parametric comparisons used the Kruskal–Wallis test with as the effect-size measure, followed by Dunn's post-hoc test with Bonferroni correction. Pairwise top-vs-bottom quartile contrasts were summarized using the Mann–Whitney U test with rank-biserial correlation and Cliff’s as distribution-free effect sizes.
Finally, to test robustness to risky-driving category choice, harsh braking and speeding EPV were used as alternative dependent variables in OLS and as alternative risky-driving predictors in NB GLM, while accident count remained the NB GLM dependent variable. This cross-category replication distinguishes category-specific patterns (e.g., fleet-scale concentration of harsh acceleration) from patterns generalizing across risky-driving behaviors. The validation procedures therefore complement OLAP: OLS assesses whether workforce-composition patterns from OLAP-based quartile comparisons generalize across the full Local/Route Bus sample, while NB GLM tests whether OLAP-identified spatiotemporal hotspots are statistically linked to accident occurrence after trip-exposure control, distinguishing raw-volume hotspots from exposure-adjusted accident-count correlates.
RESULTS AND DISCUSSION
1. Case Study Context and Analytical Scenarios
This section introduces the 2019 Daejeon case study and two scenario-based analyses of organization-level and spatiotemporal heterogeneity in DTG risky-driving event burdens and accident linkage.
Case-study year selection Approximately 8,400 traffic accidents occurred in Daejeon in 2019, representing the peak within the 2018–2023 observation period. The annual count then declined through 2022 before increasing again in 2023. 2019 was selected as the focal year because it simultaneously captures the highest local accident burden within the observation window and is the last full pre-pandemic year—thereby avoiding the large and heterogeneous disruptions to commercial vehicle operations, travel demand, and accident exposure that characterized 2020–2022. Robustness of the main findings to alternative focal years is discussed as a limitation.
This aggregate trend provides context but cannot account for heterogeneous company characteristics, driver composition, or fine-grained spatiotemporal structure. The results therefore develop two scenario-based analyses using staged OLAP exploration. Scenario I narrows organization-level management priorities through roll-up by company type, slice to the highest event-burden type, dice by fleet-size group, drill-down to individual companies, and post-OLAP OLS validation. Scenario II examines spatiotemporal hotspots through spatial roll-up and drill-down, company-type disaggregation, temporal drill-down, and post-OLAP NB GLM validation.
2. Scenario I. Organization and Driver Level Heterogeneity in Risky Driving
Scenario I progressively narrows organization-level management priorities through four staged OLAP operations, followed by post-OLAP statistical validation.
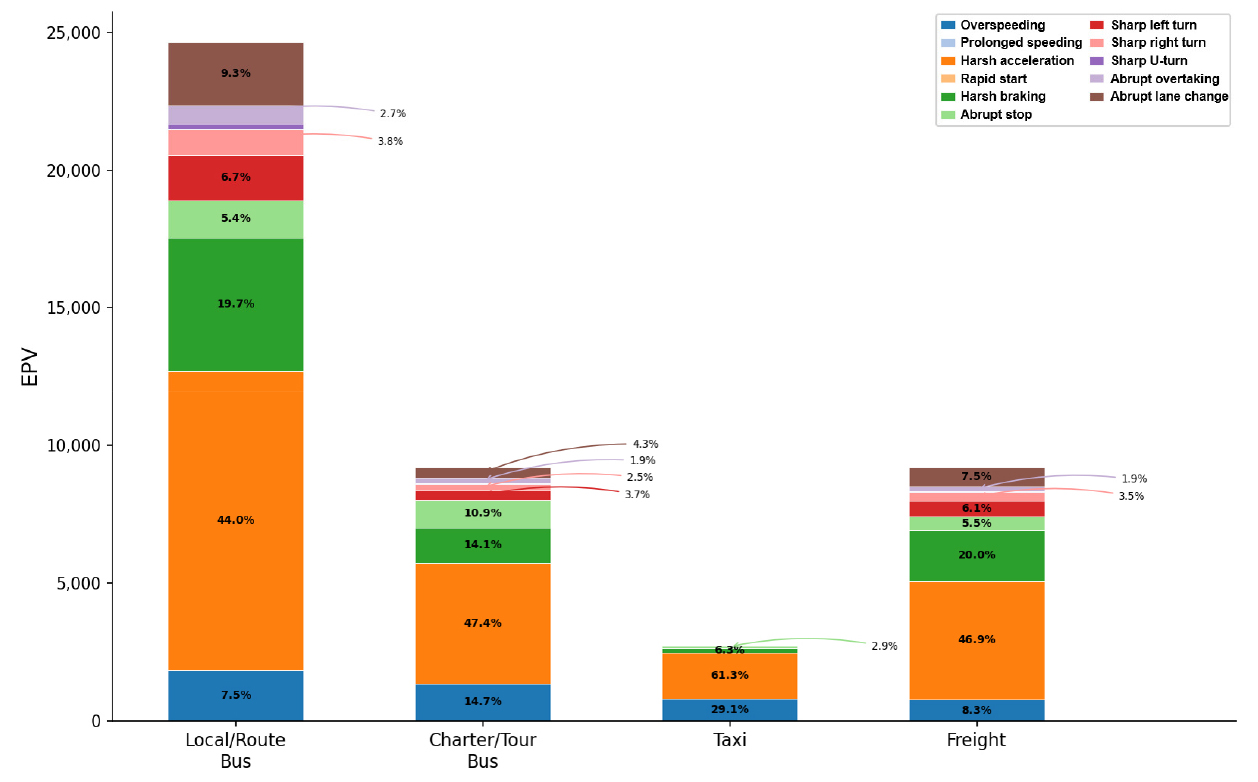
Company-type roll-up The analysis begins by rolling up the company dimension to the company-type level and comparing 2019 annual EPV across transportation-company types.
Local/Route Bus exhibits the highest EPV among all company types, with harsh acceleration accounting for 44.0% of total EPV, followed by harsh braking (19.7%) and abrupt lane change (9.3%) (Figure 3). Taxi shows the lowest overall EPV but a relatively high speeding share (29.1%). Company type thus serves as the primary classification axis, and Local/Route Bus is selected for subsequent analysis as the highest event-burden category.
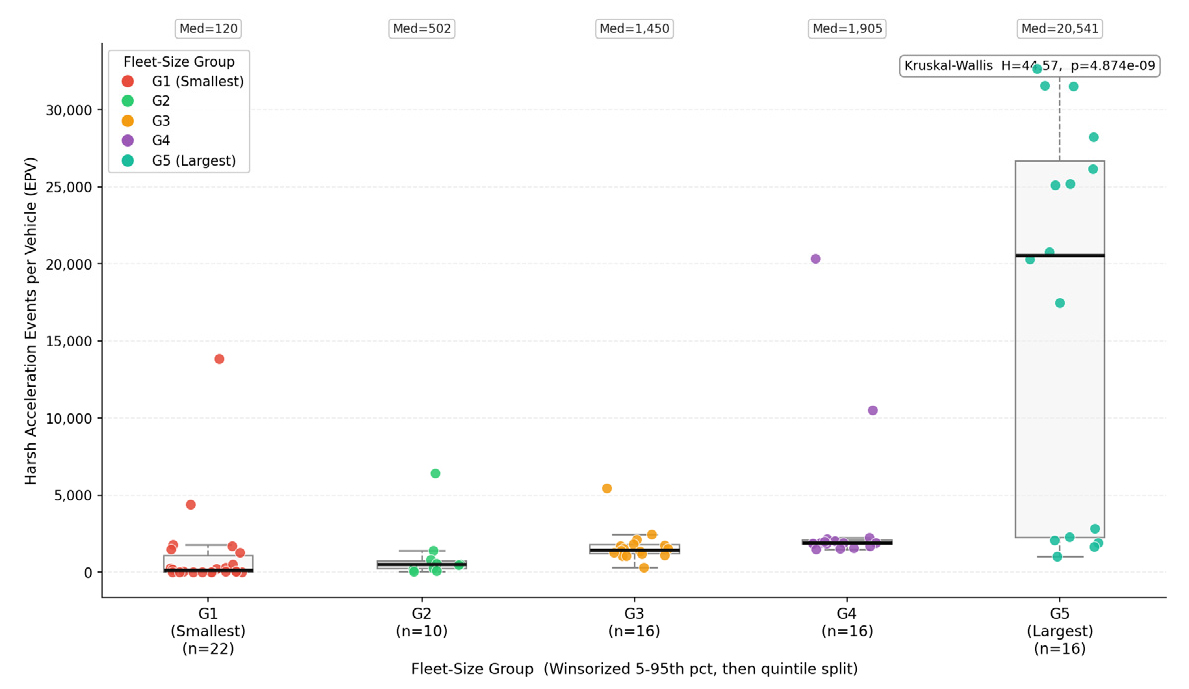
Fleet-size segmentation within Local/Route Bus The cube is sliced to Local/Route Bus operators and drilled down to company-scale groups to compare harsh-acceleration EPV by fleet size.
Median harsh-acceleration EPV increases monotonically from G1 (120) to G5 (20,541), with significant between-group differences (Kruskal–Wallis ) (Figure 4). G5 also shows the greatest dispersion. The interpretation is refined from “Local/Route Bus has the highest event burden” to “large-fleet Local/Route Bus operators concentrate the greatest harsh-acceleration monitoring burden.” Because EPV is normalized by registered vehicles rather than by VKT, vehicle-hours, or service frequency, this pattern should be interpreted as fleet-level event burden rather than pure risky-driving propensity.
Workforce comparison by EPV quartile The analysis drills down to individual Local/Route Bus companies and compares the top- and bottom-quartile harsh-acceleration EPV groups across workforce and operational characteristics.
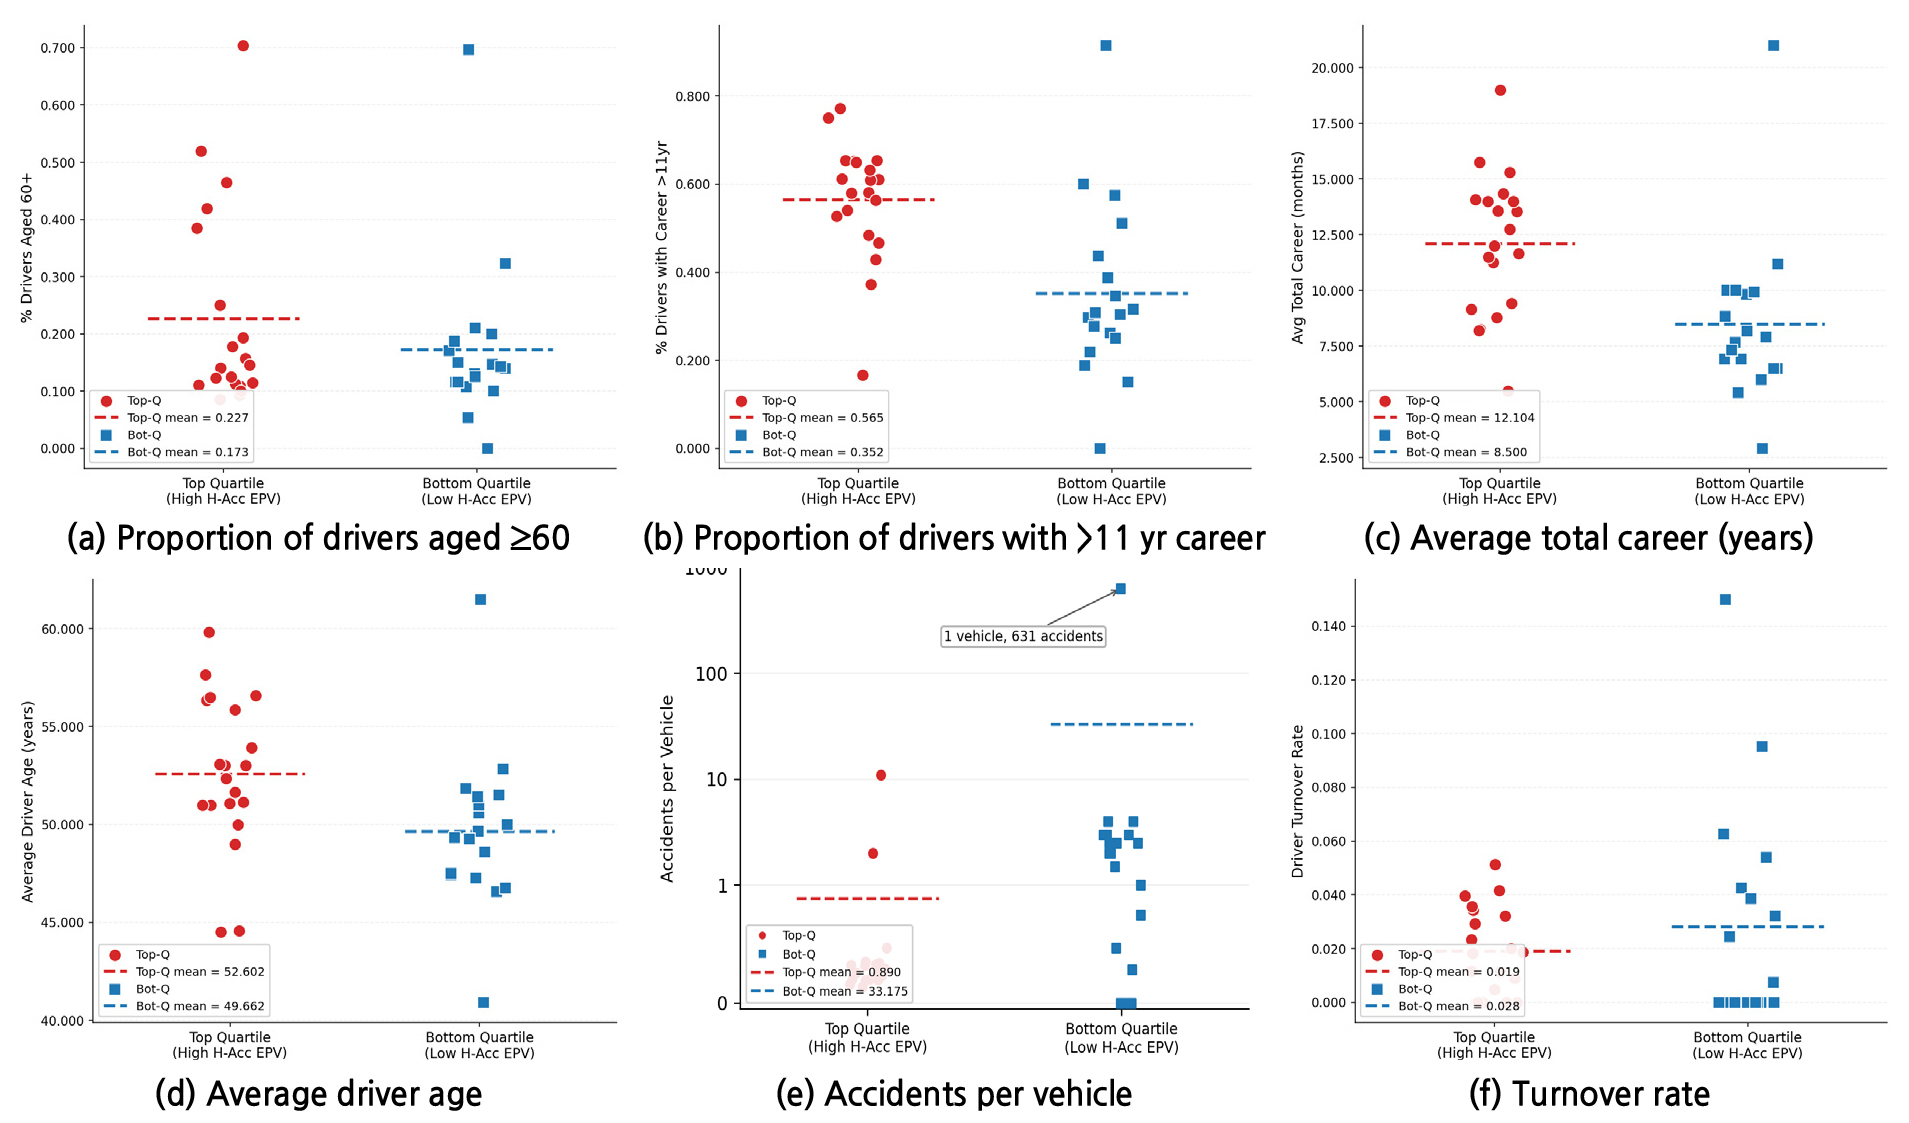
High-EPV companies are distinguished by long-career driver concentration, not elderly driver proportion (Figure 5). The high-EPV group shows significantly higher long-career driver proportion (total commercial-driving career >11 yr) (0.565 vs. 0.352, ), average total career (12.10 vs. 8.50 yr, ), and average driver age (52.60 vs. 49.66, ). Neither the proportion of drivers aged ≥60 () nor the turnover rate () differs significantly. The accident indicator requires caution: mean accidents per vehicle is higher in the low-EPV group (33.175 vs. 0.890, ), but this pattern is dominated by a denominator-sensitive outlier. One company in the low-EPV group has one registered vehicle and 631 linked accidents, yielding accidents per vehicle of 631. Median values are much less extreme (2.000 in the low-EPV quartile and 0.285 in the high-EPV quartile). The key finding is therefore that high-EPV operators are characterized by long-career workforce concentration, while the accidents-per-vehicle contrast is unstable and sensitive to exposure and linkage structure.
Post-OLAP validation OLS regression confirms part of these patterns across the full Local/Route Bus sample (Table 2). The HC3-robust model explains 40.3% of EPV variance (, , ). Long-career driver proportion shows a significant positive association (, ), whereas average total career is not significant after robust correction (, ). The proportion of drivers aged ≥60, by contrast, shows a significant negative adjusted coefficient () despite being non-significant in the unadjusted top-vs-bottom quartile comparison (). This sign reversal is interpreted as a suppression-type partial effect and should be limited to harsh-acceleration EPV. A correlation check confirms that age-≥60 and long-career proportion are moderately but not perfectly correlated (), supporting this adjusted-effect interpretation.
Table 2.
HC3-robust OLS results for harsh-acceleration EPV among Local/Route Bus companies
Diagnostic checks support a cautious interpretation. VIF values remain below the conventional threshold, indicating that severe collinearity does not drive the coefficient signs. HC3 robust standard errors leave the senior-driver and long-career proportions significant, whereas average total career is not significant. Robustness checks further show that the accidents-per-vehicle term is unstable: its coefficient is essentially null in the base HC3 model, non-significant in Huber robust regression (), and sensitive to outlier removal or winsorization choices. These diagnostics support interpreting accidents per vehicle as a denominator- and linkage-sensitive control rather than as evidence that higher DTG EPV reduces accident risk.
To test category specificity, the OLS pipeline was re-run with harsh braking and speeding as alternative dependent variables. Cross-category replication shows that the workforce-composition pattern is strongest for harsh acceleration and harsh braking, but weaker for speeding. Harsh braking shows higher model fit (), whereas speeding has weaker fit () and a different association profile. These contrasts support category-specific safety management rather than a uniform interpretation of all DTG risky-driving indicators.
In summary, harsh-acceleration event burden is associated with company type, fleet scale, and workforce career structure. This pattern extends partly to harsh braking but not uniformly to speeding. OLAP functions as an interpretive workflow that narrows management priorities, while post-OLAP statistical validation clarifies the uncertainty and category specificity of these patterns.
3. Scenario II. Spatiotemporal Patterns of Risky Driving in Urban Areas
Harsh-acceleration EPV varies sharply by location, time of day, and company type. Scenario II identifies these structures through four staged OLAP operations, followed by post-OLAP NB GLM validation.
District-level spatial drill-down The location dimension is drilled down from the city level to the district () level to compare harsh-acceleration EPV across Daejeon districts.
Seo-gu is the dominant hotspot (EPV = 77.8), followed by Yuseong-gu (25.0), Dong-gu (21.7), Jung-gu (19.6), and Daedeok-gu (13.8) (Figure 6(a)). This concentration justifies finer-grained spatial examination.
Neighborhood-level drill-down The location dimension is further drilled down to the neighborhood () level to identify the dominant micro-scale harsh-acceleration hotspots.
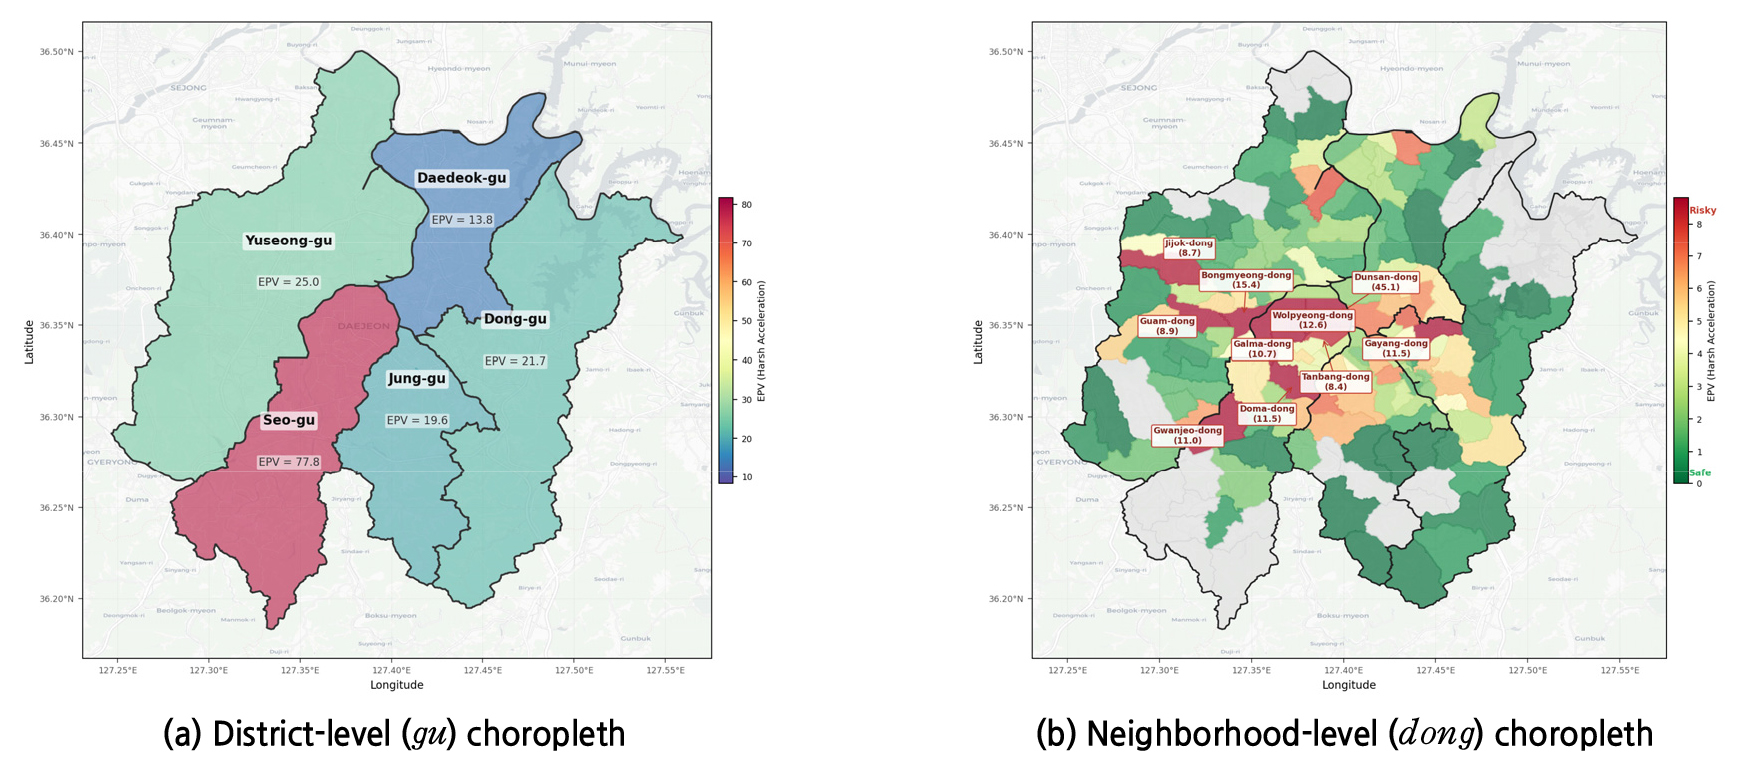
Dunsan-dong is the single dominant micro-scale hotspot (EPV = 45.1), roughly triple the next-highest neighborhood (Figure 6(b)). Secondary hotspots include Bongmyeong-dong (15.4), Wolpyeong-dong (12.6), Gayang-dong and Doma-dong (11.5 each), and Gwanjeo-dong (11.0). The district-level dominance of Seo-gu is thus driven primarily by Dunsan-dong—a pattern obscured by district-level averages.
Company-type disaggregation The cube is sliced by company type to examine whether neighborhood hotspot patterns differ across Local/Route Bus, Charter/Tour Bus, Taxi, and Freight operations.
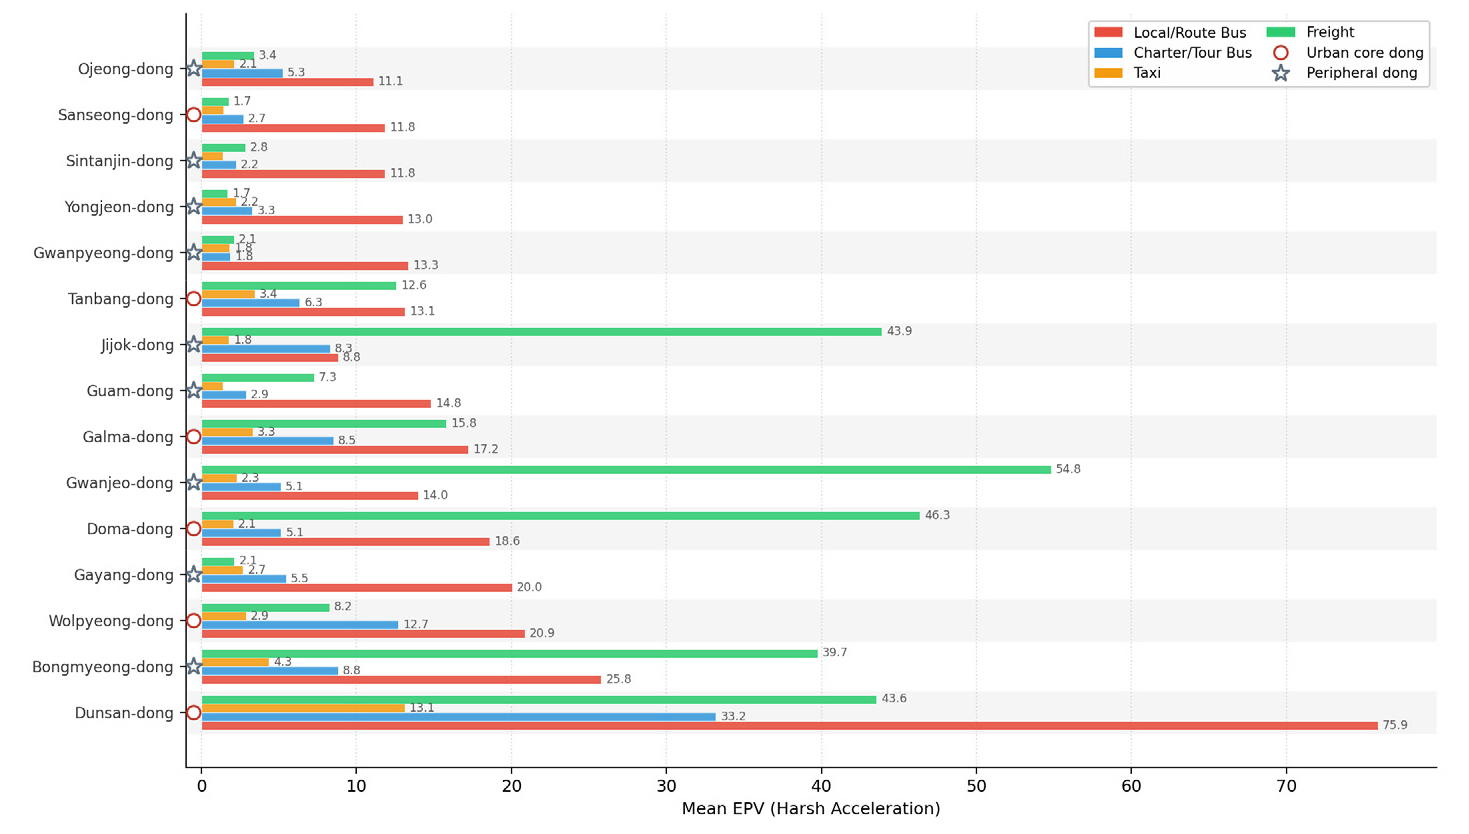
The spatial structure differs fundamentally by type (Figure 7). Bus and taxi hotspots concentrate in the urban core: Local/Route Bus peaks in Dunsan-dong (75.9), Charter/Tour Bus likewise (33.2), and Taxi shows a moderate concentration (13.1). In contrast, Freight shows the strongest hotspots in Gwanjeo-dong (54.8), Doma-dong (46.3), and Jijok-dong (43.9)—peripheral neighborhoods linked to logistics corridors. The city's hotspot structure is thus multi-layered, reflecting distinct operational contexts rather than a single spatial pattern.
Temporal drill-down The time dimension is drilled down to the hourly level while retaining company-type and hotspot-neighborhood disaggregation.
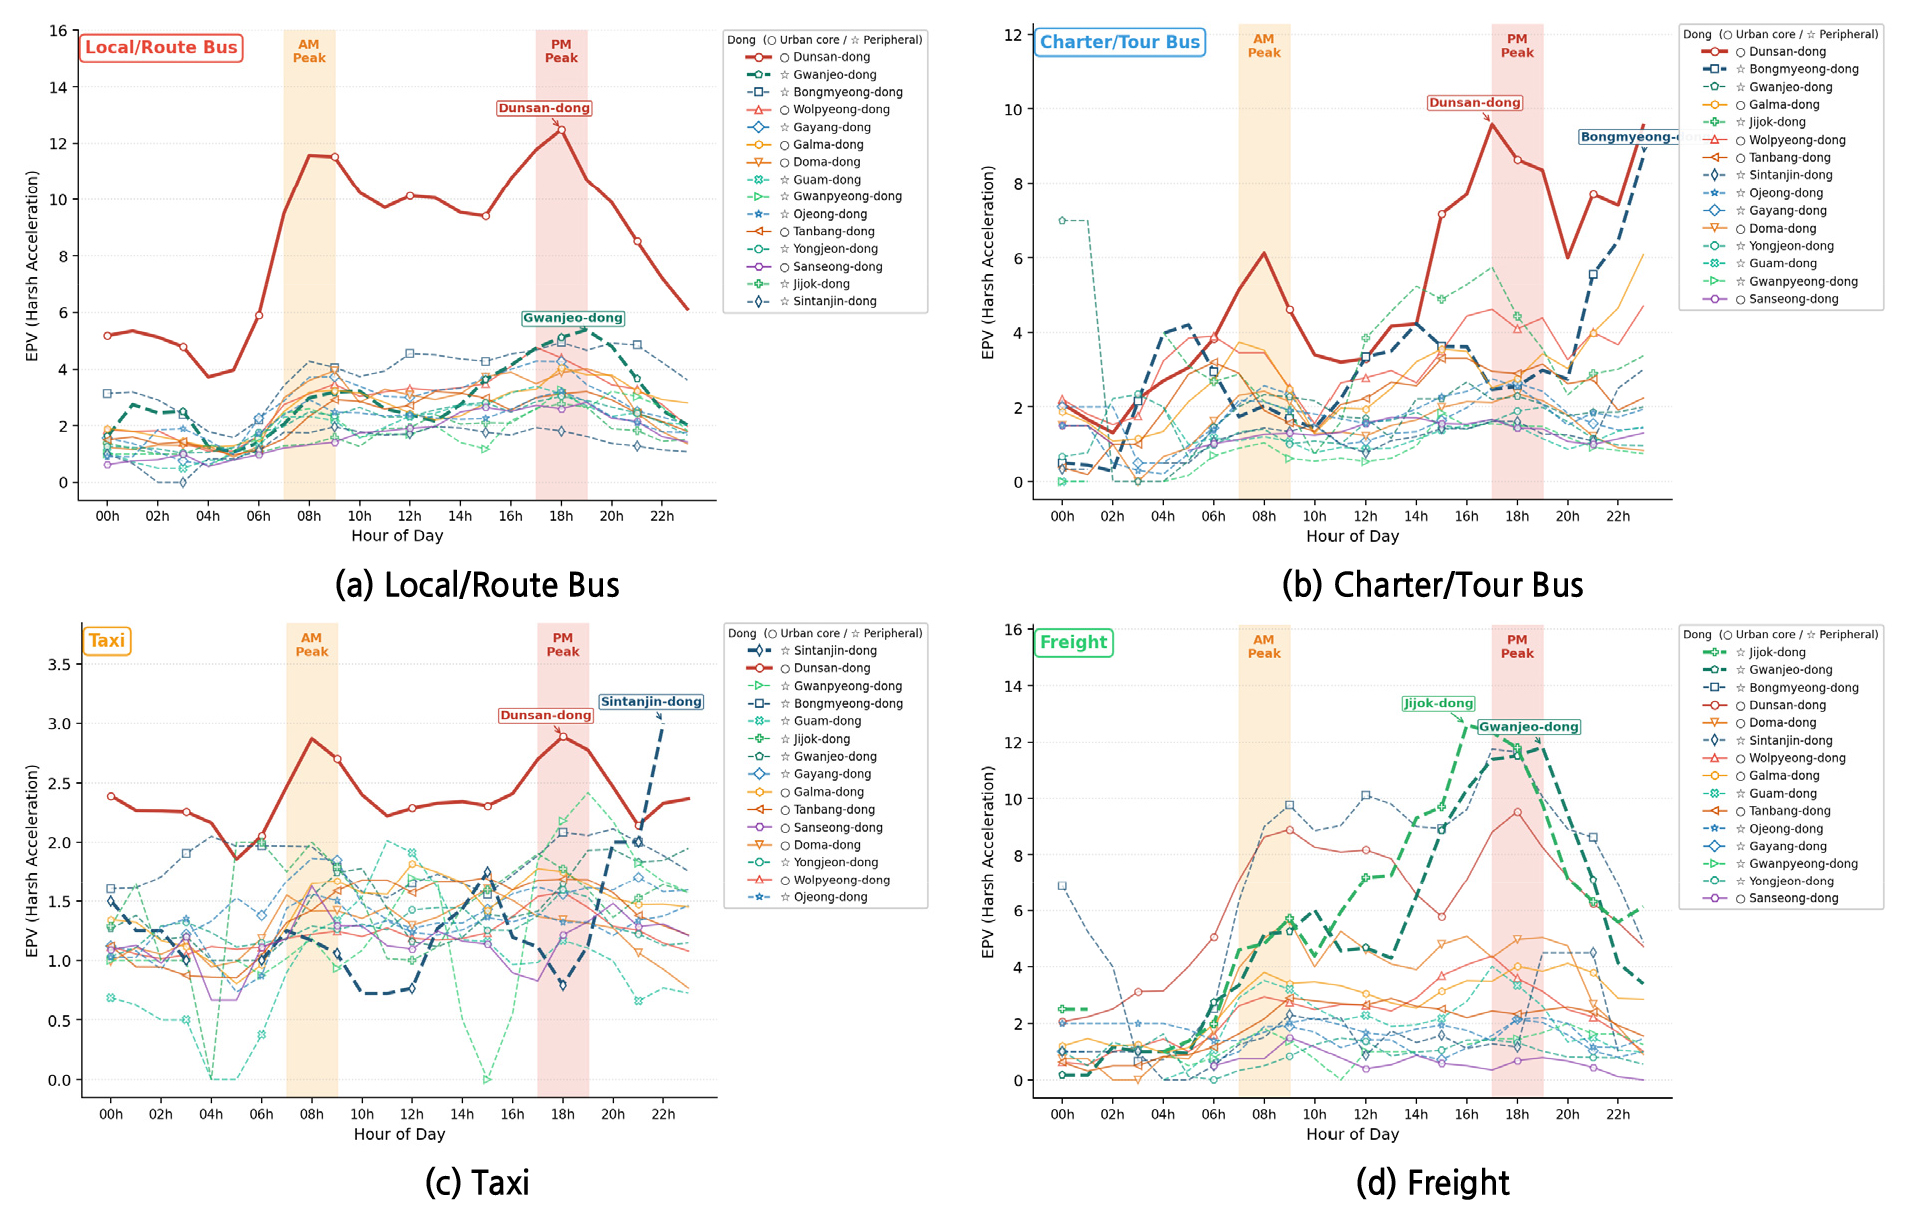
Temporal profiles vary qualitatively across types (Figure 8). Local/Route Bus shows commute-aligned dual peaks (8–9 a.m., 5–6 p.m.) centered on Dunsan-dong. Charter/Tour Bus shows evening and late-night expansion. Taxi shows a moderate, flat urban-core rhythm. Freight shows afternoon—evening peaks (4–7 p.m.) on peripheral logistics corridors. The same EPV measure thus exhibits qualitatively different temporal structures depending on company type.
Post-OLAP validation shows that exposure-adjusted accident counts are associated mainly with freight-event share, not harsh-acceleration EPV itself (Table 3 and Figure 9). Although raw risky-driving volume and accident counts are strongly correlated (), the NB GLM with trip-exposure offset reveals a different structure. The model used 616 dong×time-bin cells covering 144 dongs and five time bins; zero-accident cells accounted for 0.97%, and accident counts were overdispersed (mean = 13.51, variance = 386.71). The offset was log trips, defined as the log number of unique trip identifiers per cell. The NB model strongly outperformed the Poisson model (, , ). Freight-event share shows the strongest positive association (IRR = 7.06, 95% CI [4.19, 11.92]), whereas harsh-acceleration EPV is not significant (IRR = 1.004, ). Nighttime is also not significant (IRR = 0.953, ), and urban-core cells show an IRR below one after controlling for trip exposure, freight-event share, and time-bin effects. These estimates are exposure-adjusted associations, not causal effects; aggregation bias and unobserved route-level confounding cannot be ruled out.
Table 3.
Negative-binomial GLM results for accident counts at the dong×time-bin level
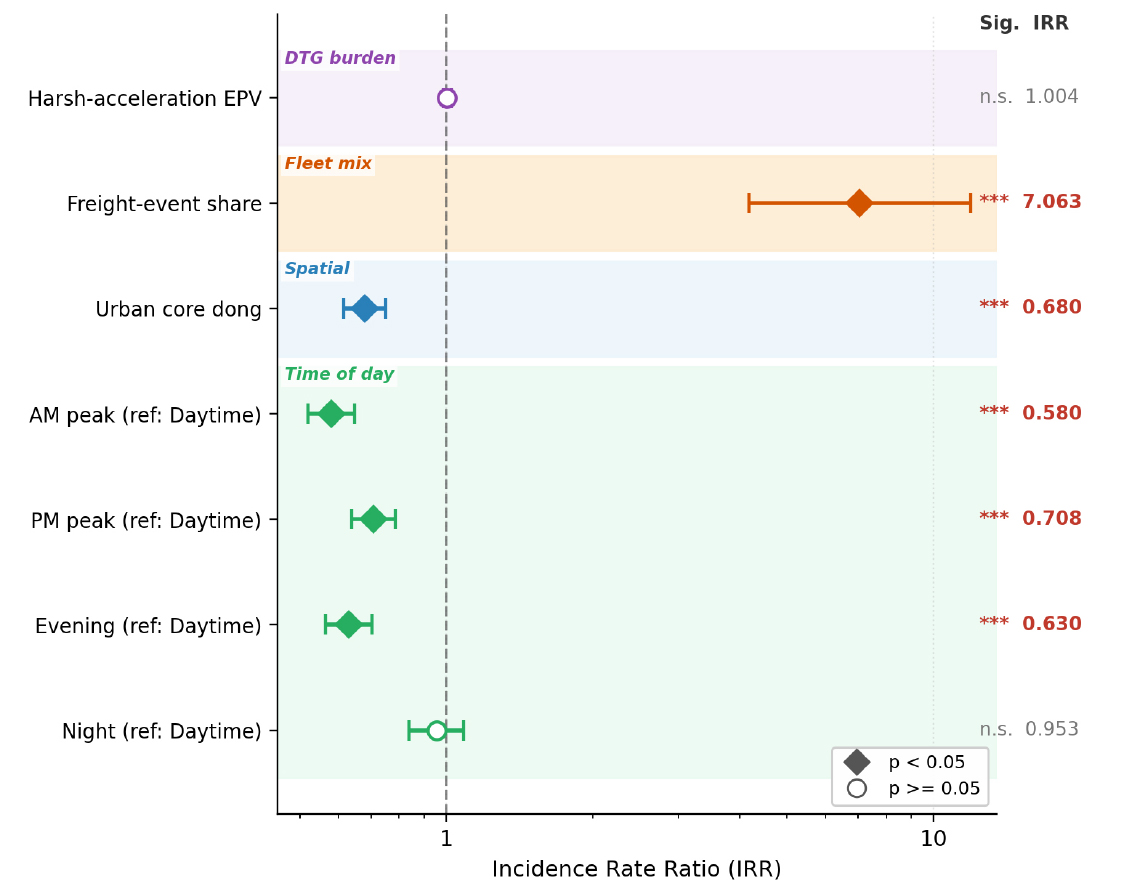
Specification checks support the negative-binomial count model and quantify remaining uncertainty. McFadden’s pseudo- was 0.065, and Cragg-Uhler/Nagelkerke pseudo- values were approximately 0.325, indicating modest explanatory contribution beyond the offset. Covariate VIFs were low, so the freight-share, urban-core, and time-bin effects were separately identified. The freight-event share confidence interval excluded one, whereas the nighttime interval included one, confirming that nighttime was not significant in the main model.
Global Moran’s I computed on Pearson residuals aggregated to dong centroids is small but significant (, ), indicating residual spatial autocorrelation not fully absorbed by the covariates. This suggests that unmodeled neighborhood-level attributes, such as road hierarchy, signalization density, or depot placement, remain relevant. A spatial-lag sensitivity model improved log likelihood and reduced from 0.072 to 0.039, suggesting that the main IRR estimates do not exhaust the spatial structure in accident occurrence. The estimates remain exposure-adjusted associations, not causal effects.
To test category specificity, the NB GLM was re-run with harsh braking and speeding as alternative risky-driving predictors while holding the offset, freight-share, urban-core, and time-bin structure fixed. Category-specific NB replications show that accident linkage differs across DTG indicators. Speeding EPV shows the clearest positive association with exposure-adjusted accident counts (IRR = 1.142, ), while harsh braking shows a smaller positive association (IRR = 1.046, ). Harsh acceleration is weaker and not robustly significant in the main model. This contrast supports using DTG categories differently for event-burden monitoring and accident-oriented prevention.
In summary, risky-driving event burden in Daejeon is differentiated by company type, space, and time, while exposure-adjusted accident-count association is dominated by freight-event share and residual spatial structure rather than by harsh-acceleration EPV itself. Post-OLAP NB GLM validation clarifies the difference between volume hotspots and exposure-adjusted accident-count correlates.
4. Discussion
Methodological implications Unlike black-box predictive models (Masello et al., 2023; Boylan et al., 2024), OLAP offers analyst-guided transparency that connects directly to safety-management workflows. The distinctive feature of the present study is that OLAP was designed as a staged interpretive process—not a flat group comparison—with post-OLAP statistical validation clarifying which patterns persisted beyond the selected sub-cubes and which required exposure- or category-specific interpretation. The validation layer combines organizational OLS diagnostics with spatiotemporal NB GLM diagnostics, including overdispersion and residual spatial-autocorrelation checks. The residual Moran’s I also prevents over-interpretation of the IRR estimates as exhaustive explanations of neighborhood accident structure.
Substantive implications for fleet safety management At the organization level, fleet supervision should target not merely large operators but specifically those with high harsh-acceleration event burden and concentrated long-career driver composition. HC3-robust OLS associated long-career driver proportion with harsh-acceleration EPV (), whereas average total career and accidents per vehicle were not statistically significant in the main specification. The workforce-composition pattern extends partly to harsh braking, while speeding shows a weaker and different association profile. The adjusted negative coefficient on the age-≥60 proportion, which reverses its unadjusted sign, is best interpreted as a suppression-type partial effect for harsh-acceleration EPV rather than as evidence that older drivers are safer in absolute terms. The policy implication is that intervention strategies should include career-stage-specific feedback and event-specific retraining rather than uniform training quotas or age-based screening.
At the spatiotemporal level, the city’s hotspot structure is multi-layered: bus and taxi hotspots concentrate in the urban core, whereas freight hotspots are associated with peripheral logistics corridors. The NB GLM shows that exposure-adjusted accident counts are most clearly associated with freight-event share, whereas harsh-acceleration EPV and nighttime are not statistically significant in the main model. Cross-category replication further shows that speeding has the clearest positive IRR linkage to accident counts once exposure is controlled. Congestion-related monitoring in urban cores remains relevant for reducing event volume, while accident-prevention priorities should give greater attention to freight-heavy and speeding-exposed contexts.
Limitations and future work Five limitations should be noted. First, the analysis covers a single city and a single focal year (Daejeon, 2019), selected because it is both the local peak-accident year and the last full pre-pandemic reference year for Korean commercial vehicle safety policy; multi-city and multi-year replication is needed to establish transferability beyond this setting. Second, EPV at the company level normalizes by fleet size rather than by vehicle-kilometers traveled, so behavioral burden and operational intensity are not fully disentangled at the organization level; a VKT- or trip-distance-based exposure denominator should be incorporated once the underlying data become consistently available. Third, the OLS and NB GLM results are associative rather than causal, and the significant residual Moran’s I indicates that unmodeled neighborhood structure (e.g., road hierarchy, signalization density, depot placement) remains; future work should adopt spatial-lag or conditional-autoregressive specifications and, where possible, quasi-experimental identification. Fourth, although the cross-category replication extends the OLAP logic to harsh braking and speeding, further category- and dimension-specific scenarios (e.g., idling, sharp lane change in relation to roadway type) remain open. Fifth, severity-oriented modeling was not fully developed; severity- stratified ordered, hurdle, or spatial count models would be valuable extensions.
Despite these limitations, the approach demonstrates that commercial vehicle risky-driving analysis becomes substantially more informative when standardized DTG indicators are embedded in a multidimensional structure with staged OLAP exploration and post-OLAP statistical validation enriched by explicit diagnostic reporting and cross-category replication.
CONCLUSIONS
This study developed a data-cube-based approach for multidimensional analysis of commercial vehicle risky driving, integrating DTG, accident, company, and driver data across five dimensions. Two scenario-based analyses demonstrated how staged OLAP exploration can progressively narrow management priorities, while post-OLAP statistical validation clarified which patterns persisted beyond the selected sub-cubes and which required exposure- or category-specific interpretation.
In Scenario I, Local/Route Bus exhibited the highest EPV among all company types; large-fleet operators concentrated disproportionate harsh-acceleration event burden; and long-career driver concentration distinguished high-EPV companies. HC3-robust OLS partially confirmed these patterns (): long-career driver proportion remained positively associated with harsh-acceleration EPV, whereas average total career and accidents per vehicle were not statistically significant. Cross-category replication showed that the organization-level pattern was stronger for harsh acceleration and harsh braking than for speeding. In Scenario II, bus and taxi hotspots concentrated in the urban core (Dunsan-dong) while freight hotspots shifted to peripheral logistics corridors, with qualitatively different temporal structures across company types. The NB GLM showed that exposure-adjusted accident counts were most clearly associated with freight-event share, whereas harsh-acceleration EPV and nighttime were not statistically significant in the main model. A small but significant residual Moran’s I signals unmodeled neighborhood structure and defines a concrete direction for spatial-lag extensions.
These findings support differentiated management strategies reflecting company type, fleet scale, driver career structure, and the distinction between event-burden hotspots and exposure-adjusted accident-count correlates. Future research should extend the analysis to multiple cities and years, incorporate vehicle-kilometers-traveled exposure, adopt spatial-lag specifications to address the observed residual autocorrelation, and broaden the staged OLAP exploration across the remaining risky-driving categories.