

Introduction
Literature Review
Methodology
1. Evaluating Measures
2. Evaluation Method
Application
1. Study Area and Data
2. Evaluation Results
3. Comparison with Conventional Redundancy Measures
4. Route-Level Comparative Analysis
Discussion and Conclusions
Introduction
Public transportation systems in metropolitan areas continue to expand as cities seek to improve urban mobility, reduce congestion, and accommodate growing and increasingly diverse travel demands. In multimodal urban environments, where buses, subways, and other transit services coexist, the efficiency of the overall network depends not only on the performance of individual routes but also on how services interact and overlap across modes. As a result, identifying and managing redundancy within public transit networks has become an important issue in transit planning and operations.
Redundancy is often discussed as a double-edged characteristic of public transit networks. While overlapping services can enhance flexibility and reliability by providing passengers with alternative travel options, redundancy that is not supported by sufficient demand may lead to inefficient resource allocation and unnecessary competition between services. Distinguishing between beneficial and inefficient redundancy therefore remains a central challenge for transit agencies, particularly in densely served urban corridors.
Although previous studies have proposed various approaches to evaluating redundancy, their practical applicability to route-level decision-making remains limited. In particular, measures based on network structure or origin–destination relationships provide limited insight into how much of a specific transit line’s usage is effectively duplicated by competing services, as they often overlook passenger demand and actual travel behavior. As redundancy is ultimately experienced through trips rather than abstract network representations, a more user-oriented and operationally interpretable approach is required to support practical decisions regarding route adjustment and network optimization.
To address these challenges, this study proposes a demand-informed approach to evaluating redundancy by focusing on directly competing modes, bus and subway, and examining the proportion of passenger trips on bus lines that overlap with subway services. Using smart card transaction data and operational information, redundancy is expressed in terms of trip proportions rather than abstract network indicators. To facilitate interpretation and policy relevance, the study adopts an importance–performance analysis (IPA) framework, which enables redundancy levels to be evaluated in conjunction with passenger demand and classified into intuitive categories for decision making.
The proposed methodology is applied to the public transit system of Seoul, South Korea, a metropolitan area characterized by a highly integrated and heavily utilized multimodal transit network. By identifying bus routes with high redundancy and insufficient demand, this study aims to provide actionable insights for improving network efficiency while maintaining service quality and user convenience.
The remainder of this paper is organized as follows. The next section reviews previous studies on redundancy in public transit networks and the application of importance–performance analysis in transportation research. The methodology and data used in this study are then described, followed by the presentation of empirical results and a discussion of their implications. Finally, the paper concludes with a summary of key findings and directions for future research.
Literature Review
Redundancy has been widely discussed in public transit studies as an important concept for evaluating network efficiency, service overlap, and system resilience. Early research primarily conceptualized redundancy as a spatial phenomenon, focusing on the geometric overlap of transit lines within a network. These line-based approaches measured redundancy using indicators such as overlapping route length or buffer-based proximity, providing intuitive assessments of network structure and coverage (Benn, 1995; Yoon, 2000; Yoon, 2002; Lee and Park, 2003; Transportation Research Board, 2013). While such measures are straightforward to compute, they implicitly assume that spatial overlap directly translates into inefficient duplication, without considering how transit services are operated or utilized by passengers.
To address this limitation, subsequent studies incorporated operational characteristics by examining redundancy at the station or stop level. Station-based approaches emphasized that public transit systems function around discrete boarding and alighting points, and that overlapping services should therefore be evaluated based on stop-level service provision rather than continuous route geometry (Sung et al., 2011; Lee et al., 2019). Delmelle et al. (2012) further highlighted the trade-off between accessibility and efficiency, demonstrating that excessive overlap at stops can increase travel time while offering limited marginal benefits. These studies provided a more operationally realistic view of redundancy but remained largely supply-oriented, as passenger travel behavior was not explicitly incorporated.
More recent research has conceptualized redundancy from a functional and user-oriented perspective by focusing on origin–destination (OD) relationships. From this viewpoint, redundancy exists when travelers can reach the same destination through multiple feasible paths or modes, thereby enhancing flexibility and robustness in multimodal networks (Xu et al., 2015; Jenelius and Cats, 2015). Network-based measures such as travel alternative diversity and network spare capacity have been proposed to capture substitutability and resilience under both normal and disrupted conditions (Xu et al., 2015; Xu et al., 2018). These OD-based approaches offer a more behaviorally meaningful interpretation of redundancy; however, their results are typically expressed at the OD-pair or network level, which limits their direct applicability to route-level operational decisions.
Several studies have attempted to bridge structural and functional perspectives by emphasizing passenger usage and intermodal interactions (Almasi et al., 2018). Wei et al. (2017) evaluated public transit services by jointly considering operational efficiency and access, highlighting that performance assessment should reflect how passengers actually experience the network. Friedrich (2016) similarly proposed an evaluation framework based on entire journeys between origins and destinations, illustrating that shortcomings in transit networks often emerge only when OD-level interactions are considered. These studies reinforce the importance of interpreting redundancy not solely as structural overlap but as a phenomenon experienced through passenger trips.
Recent synthesis work further underscores the multidimensional nature of redundancy. Barzegari et al. (2026) proposed a comprehensive framework distinguishing between duplication of route segments and duplication of passenger connections, showing that conventional spatial measures tend to overestimate redundancy when passenger usage is ignored. Their findings suggest that redundancy should be interpreted in relation to both network structure and actual travel behavior, rather than as a purely negative indicator. Table 1 summarizes the perspectives on redundancy and key studies.
Table 1.
Conceptual perspectives on redundancy in public transit network studies
|
Perspective on redundancy | Unit of analysis | Key interpretation | Typical indicators | Representative studies |
|
Line-based redundancy | Line / segment |
Spatial overlap of transit lines |
Overlapping length, buffer-based overlap |
Benn (1995); Yoon (2000, 2002); Lee & Park (2003); Transportation Research Board (2013) |
|
Station-based redundancy | Stop / station |
Overlapping services at boarding points |
Number of lines per stop; stop spacing | Sung et al. (2011); Delmelle et al. (2012) |
|
OD-based redundancy | Origin–destination pair |
Availability of alternative paths or modes |
Travel alternative diversity; spare capacity | Xu et al. (2015, 2018); Jenelius & Cats (2015); Barzegari et al. (2026) |
Parallel to the evolution of redundancy concepts, importance–performance analysis (IPA) has been widely applied in public transportation research as a practical tool for evaluating service quality and prioritizing policy interventions. Originally developed in the service management literature (Martilla and James, 1977), IPA has been extensively used to assess transit service attributes such as reliability, comfort, accessibility, and transfer convenience (Friedrich, 2016; Hidayat, 2018). In multimodal transit systems, IPA has proven particularly useful for identifying service elements that require improvement by jointly considering user importance and observed performance.
Recent studies have extended the IPA methodology through alternative definitions of importance and modified interpretations of performance, demonstrating its flexibility and applicability to transportation systems (Rodriguez-Valencia et al., 2019; Tuan et al., 2022). Although IPA has traditionally focused on service quality rather than network structure, its underlying logic provides a valuable interpretive framework for redundancy evaluation. Specifically, redundancy can be regarded as a performance related attribute of transit services, while passenger demand reflects its relative importance. By combining these two dimensions, IPA enables a clear distinction between redundancy that is justified by high usage and redundancy that persists despite insufficient demand.
Taken together, the existing literature shows that redundancy has evolved from a purely spatial concept toward a functional and user-oriented interpretation, while IPA has emerged as a practical framework for translating analytical results into policy relevant insights. Nevertheless, a gap remains between analytically rich redundancy measures and intuitive tools for route-level decision-making in multimodal transit networks. To address this gap, this study operationalizes redundancy by focusing on directly competing modes, bus and subway and examining the proportion of passenger trips on bus lines that overlap with subway services. This approach builds upon OD-based concepts of redundancy while providing a more intuitive and actionable representation at the route level, which can be effectively interpreted using the IPA framework.
Methodology
This study evaluates redundancy in a multimodal public transit network by considering both spatial overlap and actual passenger usage, building on the redundancy measures employed in previous studies. Rather than relying on a single indicator, redundancy is examined from two complementary perspectives: spatial redundancy, which represents potential overlap in service provision, and trip-based redundancy, which reflects overlap as experienced through passenger trips. The two perspectives are analyzed separately and then jointly interpreted to support line level decision making. Spatial redundancy is first evaluated using a station-based approach that captures overlapping service coverage at boarding and alighting points. This representation reflects the operational characteristics of public transit systems and avoids the limitations of buffer-based line overlap measures that do not correspond to actual access points. The resulting station-based redundancy indicators are analyzed in conjunction with average passenger demand using importance–performance analysis (IPA) to identify routes where spatial overlap is relatively high compared to observed usage.
To further account for actual travel behavior, redundancy is subsequently evaluated from a trip-based perspective. Trip-based redundancy is defined as the proportion of passenger trips on a bus line that overlap with competing subway services in terms of origin–destination coverage. This measure provides a route-level interpretation of functional substitutability and complements the spatial analysis by incorporating realized passenger demand. Trip-based redundancy is again evaluated together with passenger demand using IPA, enabling a consistent comparison between potential overlap and behavioral duplication.
Finally, routes that are identified as requiring improvement in both IPA results are selected as candidates for further operational review. By combining station-based and trip-based analyses within a unified evaluation framework, the proposed methodology aims to distinguish between redundancy that is structurally present but demand-supported and redundancy that persists despite limited passenger usage.
1. Evaluating Measures
Before introducing the evaluation measures, the notations used in this study are defined as follows. Let i denote a bus line and j denote a subway line. Depending on the context, k denotes the index of bus stops. All redundancy measures are calculated for each bus line i by examining its spatial or functional overlap with competing subway lines j.
1) Line-based Redundancy
Traditional line-based redundancy is calculated by summing the lengths of bus lines within a 500-meter radius of subway lines. The formula is as follows:
where
= Line-based redundancy of bus line i,
= Length of the overlapping section between bus line i and subway line j,
= Total length of the bus line i,
= Maximum value across all subway lines j.
This measure represents the maximum proportion of a bus line that geographically overlaps with any single subway line, indicating the strongest potential spatial duplication. While line-based redundancy effectively captures geographical overlap at the route level, it does not consider station-level accessibility or actual passenger usage. Despite these limitations, this metric has been widely used in previous studies and is included in this study as a baseline indicator to enable comparison with conventional redundancy evaluation results.
2) Station-based Redundancy
The station-based redundancy metric refines the evaluation of spatial overlap by focusing on stop-level interactions. Specifically, it identifies redundant bus route segments where consecutive bus stops are both located within a 500-meter radius of the same subway station. This approach reflects the operational reality that passengers access public transit services through discrete boarding and alighting points rather than continuous route geometry. The formula is as follows:
where
= Station-based redundancy of bus line i,
= Distance between bus stops k and k+1 on bus line i,
= Indicator function that returns one if both stop k and k+1 are within 500 meters of subway line j’s stations, otherwise 0.
Unlike line-based redundancy, this measure evaluates overlap at the level of specific operational segments rather than the entire route. By focusing on station-level accessibility to subway services, station-based redundancy provides a more realistic representation of potential spatial overlap. In this study, station-based redundancy is used as the primary indicator of spatial redundancy.
3) Trip-based Redundancy
Trip-based redundancy evaluates redundancy from a demand perspective by assessing the proportion of bus passenger trips that could be substituted by subway trips, based on OD proximity. A bus trip is classified as redundant when both its origin and destination stops are located within a 500-meter radius of subway stations. To avoid misclassifying short-distance trips with inherently different travel purposes, trips shorter than 1 kilometer are excluded from the analysis. The formula is as follows:
where
= Trip-based redundancy of bus line i,
= Indicator function that returns 1 if the origin stops and destination stop of trip k are both within 500 meters of subway line j’s stations, otherwise 0,
= Total number of trips on bus line i.
This metric quantifies redundancy as the share of actual passenger trips that are functionally duplicated by subway services. A higher trip-based redundancy value indicates that a larger proportion of trips on a bus line could be replaced by subway services, suggesting potential inefficiency when such overlap is not supported by sufficient demand. Trip-based redundancy is not intended to replace spatial redundancy measures but to complement them by incorporating realized passenger travel behavior that cannot be captured through spatial analysis alone.
4) Average Number of Passengers
The average number of passengers for a line is calculated as the mean number of passengers on a bus per hour. The formula is as follows:
where
= Average number of passengers per section on bus line i,
= Number of passengers between bus stops k and k+1 on bus line i,
= Total number of bus stops on bus line i,
= Total operational hours of bus line i.
5) Average Number of Passengers in Redundant Sections
The average number of passengers in redundant sections is calculated as the mean number of passengers per hour in overlapping segments identified by the redundancy measures. The formula is as follows:
where
= Average number of passengers in redundant sections on bus line i.
6) Average Number of Passengers in Non-redundant Sections
The average number of passengers in non-redundant sections was calculated as the mean number of passengers per hour in non-overlapping segments. The formula is as follows:
where
= Average number of passengers in non-redundant sections on bus line i.
The indicators in Sections 5 and 6 enable a direct comparison of demand levels between redundant and non-redundant sections, providing an initial assessment of whether spatial redundancy is supported by sufficient passenger usage.
2. Evaluation Method
The proposed redundancy evaluation method in this study involves the following steps:
Step 1. Comparison of Demand in Redundant and Non-redundant Sections
The first step examines whether sufficient demand exists in redundant sections of transit routes. Using smart card data, the average number of passengers in redundant sections is compared with that in non-redundant sections. If demand in redundant sections is consistently lower, this suggests the presence of unnecessary redundancy caused by insufficient passenger usage.
Step 2. IPA Quadrant Analysis of the Selected Bus Lines
In the second step, importance–performance analysis is applied to jointly interpret redundancy and passenger demand. Two separate IPA analyses are conducted: one using station-based redundancy and the other using trip-based redundancy as the performance axis, with the average number of passengers as the importance axis. Bus lines located in the second quadrant, characterized by high redundancy and low demand, are identified as candidates for further evaluation.
Step 3. Identification of Bus Lines Requiring Improvement
In the final step, bus lines that are consistently classified in the second quadrant in both station-based and trip-based IPA analyses are identified as having substantial unnecessary redundancy. These lines are prioritized for operational improvement measures, such as route realignment or service frequency adjustment.
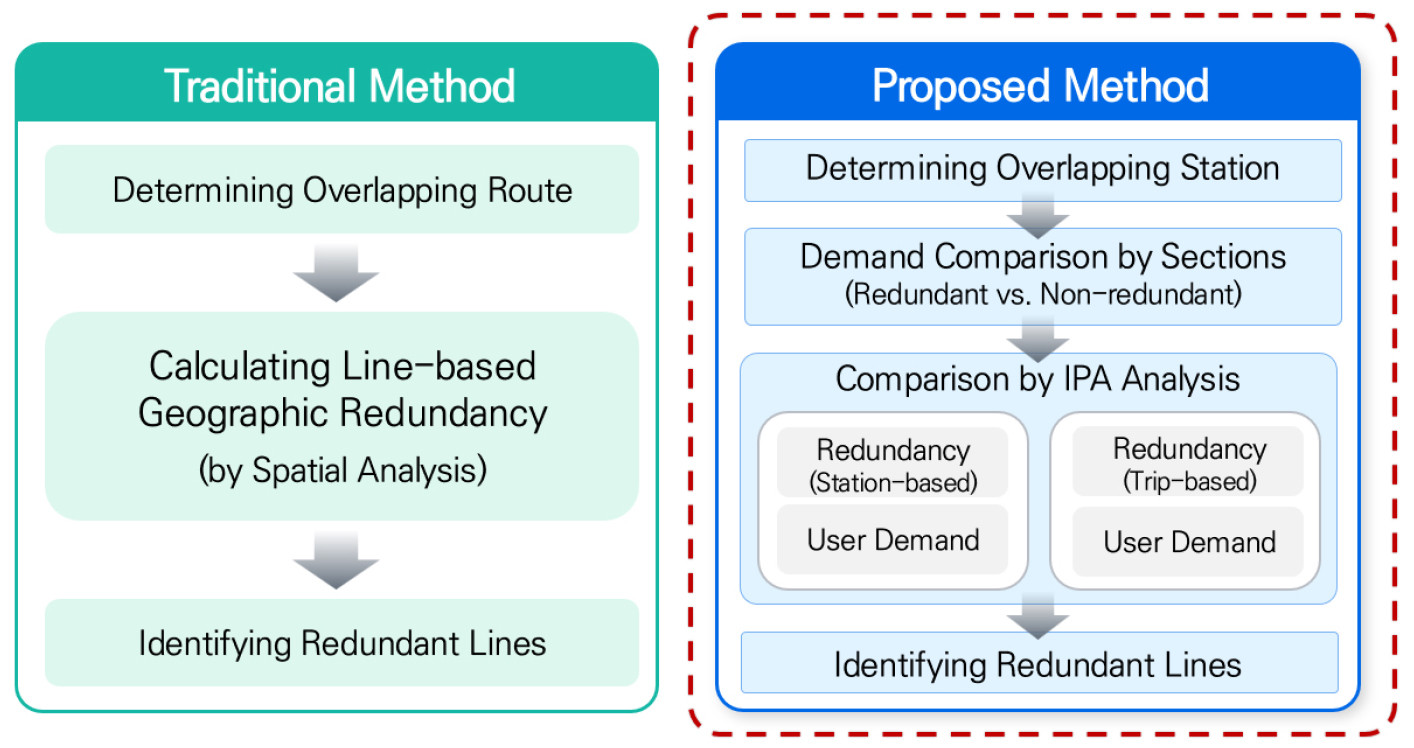
This stepwise evaluation framework enables redundancy to be assessed from both spatial and behavioral perspectives while maintaining consistency with conventional redundancy evaluation approaches. The differences between the traditional method and the proposed method are illustrated in Figure 1.
Application
1. Study Area and Data
This study examines intermodal redundancy between bus and subway services in Seoul, Korea. Seoul was selected because it operates a highly integrated multimodal public transit system in which buses and subways serve as the primary modes, and potential functional redundancy is expected to occur in multiple corridors. The analysis focuses on 348 city bus lines. Lines operating only during specific periods (e.g., commuter-only routes) and recently discontinued or substantially adjusted routes were excluded. Local bus lines were also excluded because they mainly provide local circulation and do not directly compete with subways.
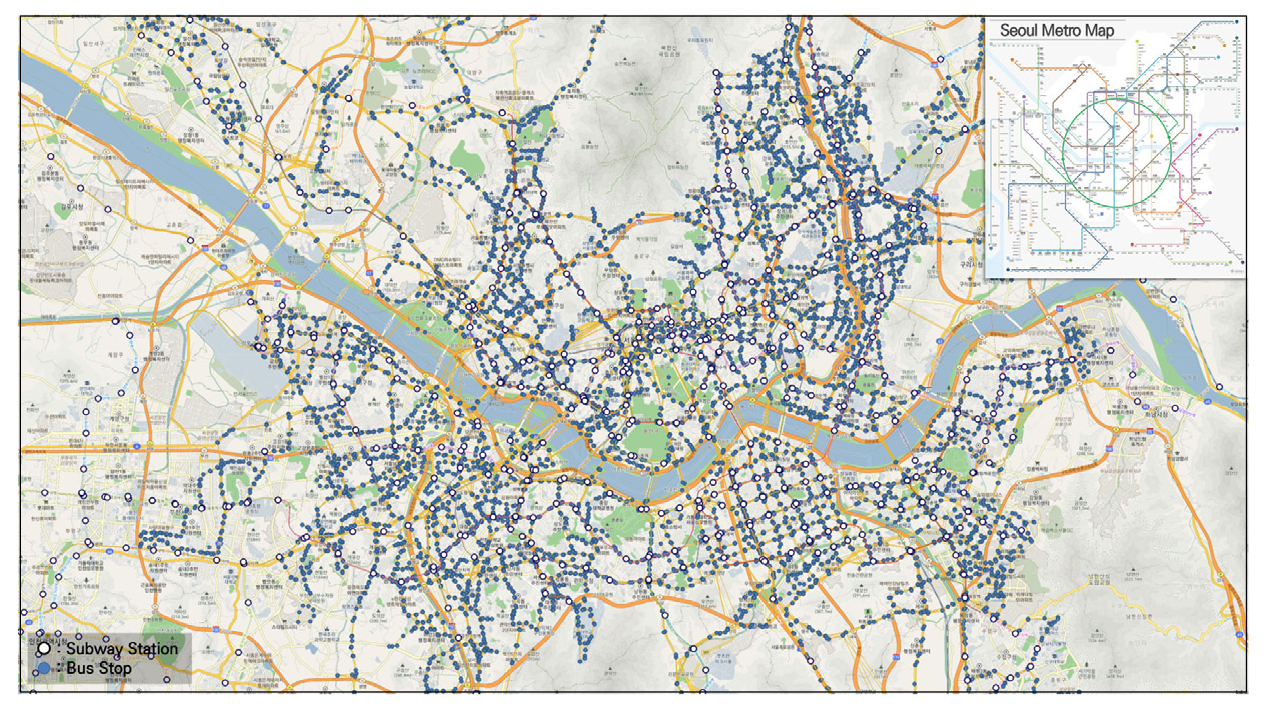
Three datasets collected in May 2023 were used: smart card transaction data, Bus Management System (BMS) data, and GIS data for subway station locations. Table 2 above summarizes the datasets and key variables. The smart card data contain detailed trip records for public transit trips within the Seoul metropolitan area, including mode, route IDs, boarding and alighting times and locations, and trip distance. These data were used to calculate trip-based redundancy and passenger demand indicators. The BMS data provide operational information for Seoul’s city buses, including bus stop locations and vehicle arrival/departure information, which were used to compute spatial measures and segment-level passenger statistics. The GIS data includes the locations of all subway stations in the Seoul metropolitan area as of May 31, 2023 and was used to assess spatial relationships between bus and subway stations. The spatial distribution of stations is shown in Figure 2.
Table 2.
List of data used and their features
2. Evaluation Results
The evaluation was conducted for 348 city bus lines. As a first step, this study aimed to preliminarily identify lines that may exhibit unnecessary redundancy relative to observed passenger demand and to verify the appropriateness of the proposed redundancy indicators. For all 348 lines, we compared average passenger demand between redundant and non-redundant sections within each line. In this comparison, redundant sections were defined based on station-based (stop-level) spatial redundancy. The comparison results are summarized in Table 3. Among the 348 lines, 121 lines (34.8%) showed lower passenger demand in redundant sections than in non-redundant sections, indicating that the overlapping segments with subway access are not supported by sufficient demand and therefore may represent a risk of unnecessary redundancy (hereafter referred to as “deficit lines”). In contrast, the remaining 227 lines exhibited higher demand in redundant sections than in non-redundant sections (“sufficient lines”), suggesting that their overlap with subway-accessible segments is more likely justified by passenger usage. This contrast is also reflected in the magnitude and direction of the passenger-demand differences. For the overall sample, redundant sections recorded 11.2 more passengers per hour than non-redundant sections, corresponding to an increase of 14.2%, which is consistent with the expectation that overlapping corridors are often located in high-demand areas. For the sufficient group, the redundant sections had 26.5 more passengers per hour than the non-redundant sections, an increase of 36.5%, indicating that overlap can be demand-supported and therefore not necessarily inefficient. However, for the deficit group, redundant sections had 17.4 fewer passengers per hour than non-redundant sections, a decrease of 19.1%, implying that these lines have overlapping segments where demand is relatively weak, and thus may involve unnecessary redundancy.
Table 3.
Comparison results of passenger numbers in redundant and non-redundant sections
Next, we examined whether redundancy levels differ systematically between the deficit and sufficient groups depending on the redundancy measure. The line-based redundancy of the two groups is almost identical, suggesting that conventional geometric overlap measures provide limited discriminatory power for identifying demand-deficient redundancy. In contrast, the differences become clearer when using station- and trip-related indicators. The deficit group shows higher redundancy values than the sufficient group for both station-based redundancy and trip-based redundancy, indicating that the proposed measures are more sensitive to demand-related redundancy patterns. Overall, line-based redundancy tends to yield higher values than station- and trip-based redundancy, supporting the interpretation that purely geometric overlap can overstate redundancy when stop-level accessibility and passenger travel behavior are not explicitly considered.
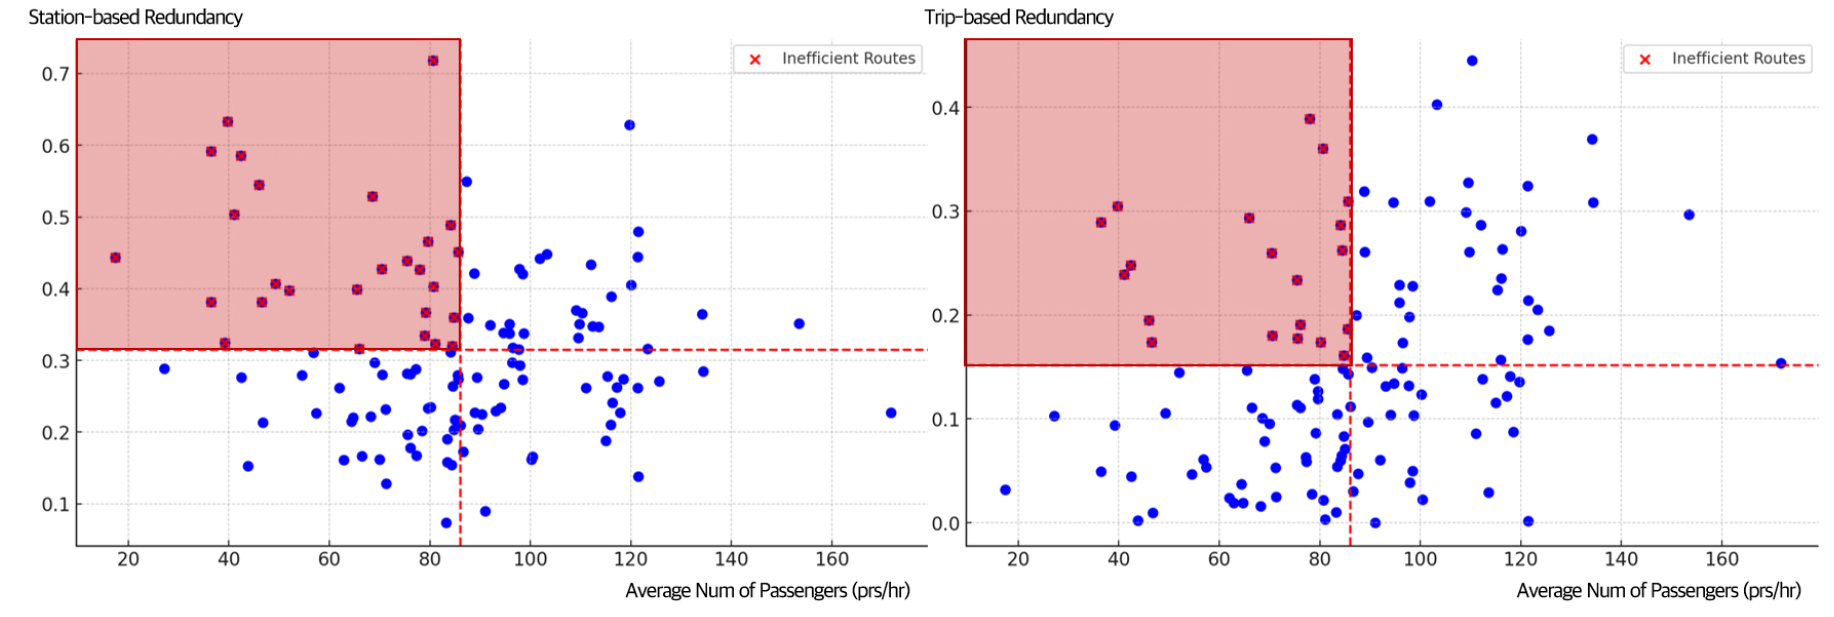
Based on the above screening, the subsequent IPA analysis was conducted only for the 121 deficit lines, because these lines simultaneously exhibit (i) overlapping segments defined by station-based spatial redundancy, and (ii) relatively insufficient demand in those overlapping segments compared to the non-overlapping segments. Two IPA quadrant analyses were then performed to identify routes requiring improvement by jointly considering redundancy and absolute demand. Specifically, station-based and trip-based redundancy were separately used as the redundancy (performance) axis, and the average number of passengers was used as the demand (importance) axis. Figure 3 visualizes the two IPA results for the 121 deficit lines. In each plot, lines in the second quadrant represent lines with high redundancy but low demand, indicating potential candidates for operational review.
To ensure robust identification, this study adopted a conservative selection rule: only lines that fall into the improvement-priority quadrant in both IPA analyses were selected. Applying this rule, 14 lines (11 branch and 3 trunk buses) were identified as requiring redundancy modification. Table 4 summarizes their characteristics. These lines show substantially higher redundancy than the overall average, while their average demand is lower, supporting the interpretation that high redundancy is not supported by sufficient demand.
Table 4.
Results of identifying routes needing redundancy improvement
3. Comparison with Conventional Redundancy Measures
This study proposes a new methodology for evaluating intermodal redundancy in public transportation systems and identifies 14 transit lines requiring improvement based on the combined consideration of redundancy and passenger demand. To assess how the proposed method differs from conventional approaches, the top 14 lines with the highest geographical redundancy were also examined. Interestingly, only two lines, buses 1138 and 6629 were commonly identified by both methods, highlighting the limitations of line-based evaluations in capturing meaningful redundancy from an operational and user-oriented perspective.
In the traditional geographical redundancy analysis, the top 14 lines exhibited an average line-based redundancy of 77.1%, which is substantially higher than the corresponding station-based redundancy of 55.3% and trip-based redundancy of 21.5%. This discrepancy indicates that relying solely on geographical overlap tends to overestimate unnecessary redundancy, as such measures do not account for service accessibility at the station level or the actual travel paths chosen by passengers. As a result, lines with extensive geometric overlap may still provide unique services that are not easily substituted in practice.
By contrast, the evaluation results derived from the proposed method show a more balanced distribution of redundancy across different indicators. For the 14 lines identified as requiring improvement, the average line-based redundancy was 54.0%, while the station-based and trip-based redundancies were 48.8% and 27.5%, respectively. These values suggest that the proposed method captures redundancy more conservatively by incorporating both stop-level interactions and user travel behavior, leading to an assessment that is more closely aligned with functional redundancy as experienced by passengers.
Table 5 provides a detailed comparison between lines identified as redundant by the proposed method and those identified by the traditional method. The results indicate clear differences in redundancy patterns and passenger demand between the two groups. Lines identified only by the traditional method generally exhibit high line-based redundancy but relatively low trip-based redundancy and higher passenger demand, implying that their overlap with subway services is largely demand-supported. In contrast, lines identified only by the proposed method show trip-based redundancy levels that are nearly twice the system-wide average, accompanied by lower passenger demand in redundant sections. This contrast demonstrates that the proposed framework is more effective in distinguishing between redundancy that is operationally justified and redundancy that may indicate inefficiency.
Table 5.
Comparison results of the proposed methods and the traditional method
Table 6 summarizes a further comparison of 71 bus lines with more than 50% line-based geographical redundancy and classifies them according to whether they were identified as redundant by the traditional method, the proposed method, both, or neither.
Table 6.
Comparison of redundancy and passenger metrics for identified redundant lines
A further comparison of 71 lines with more than 50% geographical redundancy reinforces this interpretation. Of these lines, eight were identified as redundant by both methods, while the remaining 63 were classified as redundant only by the conventional approach. Despite their high average line-based redundancy of 62.0%, these 63 lines exhibited relatively low station-based (43.2%) and trip-based (17.7%) redundancy and had higher passenger demand in redundant sections than in non-redundant sections. This suggests that their redundancy is supported by sufficient demand and may therefore be necessary for maintaining service coverage. Conversely, the proposed method identified six lines that were not flagged by the traditional method; although their line-based redundancy was close to the overall average, their trip-based redundancy was significantly higher, and their redundant sections showed lower passenger demand. These findings indicate that the proposed method is capable of detecting functional redundancy that is not apparent from geometric overlap alone.
4. Route-Level Comparative Analysis
To illustrate how the two approaches lead to different interpretations at the line level, two representative lines were selected for closer examination: bus 1114, identified as problematic by the traditional method but not by the proposed method, and bus 2115, identified as problematic by both methods. The route maps for these lines are shown in Figure 4. Bus 1114 exhibited a high line-based redundancy of 86.0% with the UI Line, the second-highest geographical redundancy among the 348 evaluated lines. However, the route map reveals that many of its stops are not located near subway stations. Consequently, the station-based redundancy was reduced to 51.3%, and the trip-based redundancy was only 8.4%, indicating that most trips on this line cannot be easily substituted by subway services. This reflects the role of bus 1114 in serving areas not effectively covered by the subway network.
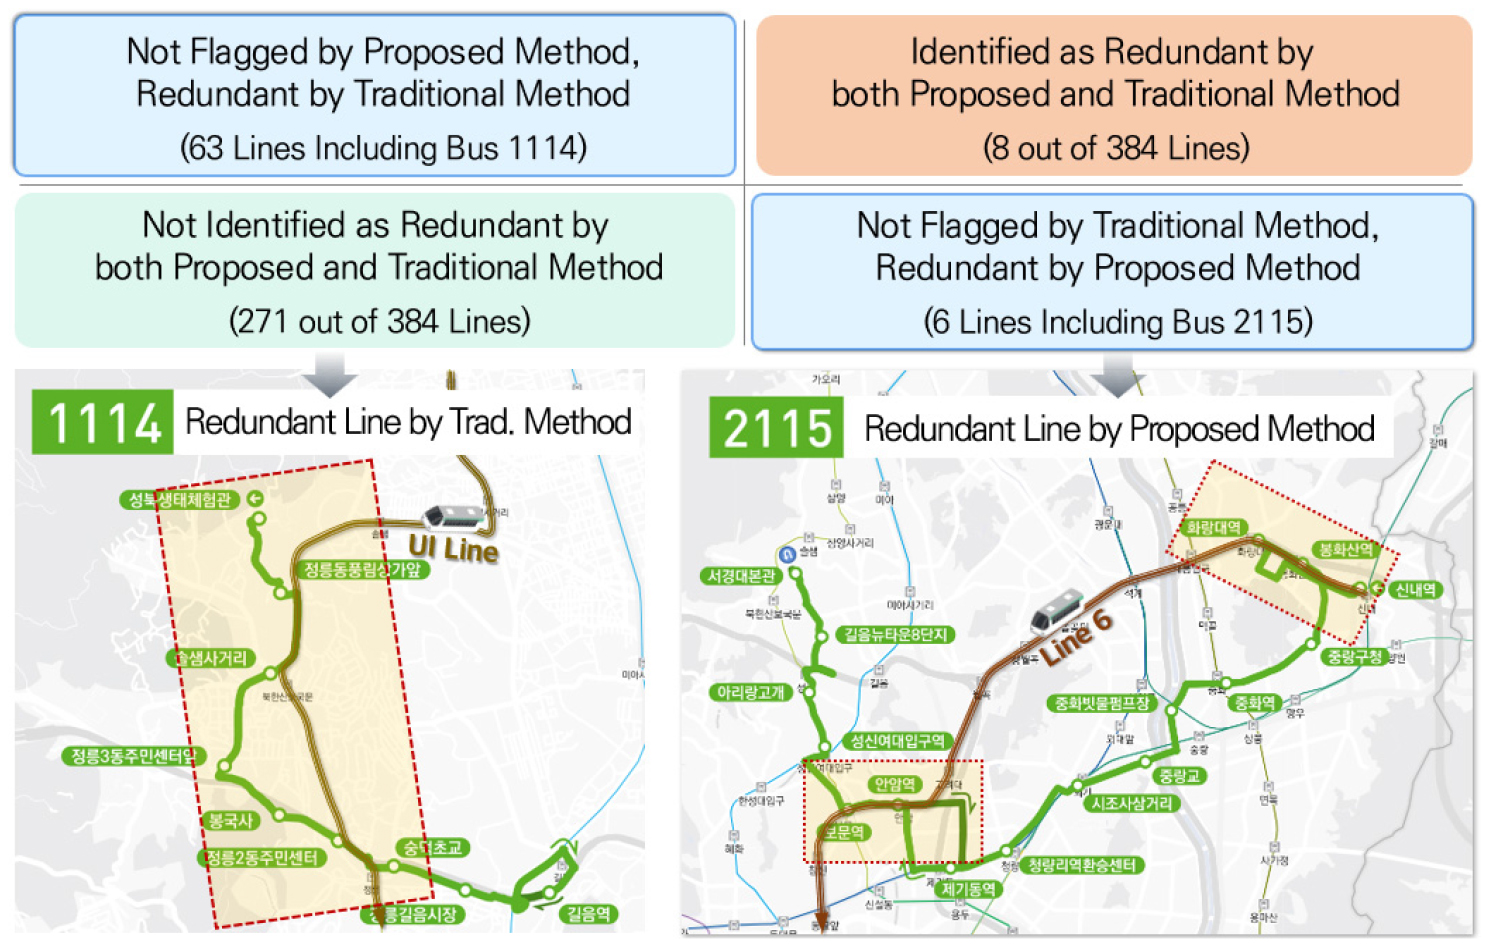
In contrast, bus 2115 showed a relatively low line-based redundancy of 33.5% with Line 6, suggesting limited geometric overlap. However, the overlapping segments are concentrated around subway stations, resulting in a station-based redundancy of 32.0% and a trip-based redundancy of 26.3%. This indicates that a substantial share of trips on bus 2115 can be substituted by subway services despite the limited geographical overlap. Further examination revealed that the initial segment of bus 2115 overlaps with high-demand subway stations such as Bonghwasan and Hwarangdae but exhibits relatively low passenger demand, with many trips destined for areas already well served by Line 6. Consistent with the implications of this analysis, the initial segment of bus 2115 has been adjusted in the current network configuration.
Overall, the comparative analysis of buses 1114 and 2115 demonstrates that redundancy identified through geometric overlap alone does not necessarily correspond to functional redundancy from a user perspective. By integrating stop-level accessibility, passenger travel behavior, and demand information, the proposed method provides a more reliable basis for identifying routes where redundancy reduction may improve operational efficiency without compromising accessibility. For example, lines such as 3412, 7011, 3214 and 109 exhibit relatively low line-based redundancy but high station- and trip-based redundancy, indicating functional overlap with subway services concentrated around major stations. These cases further support that the differences illustrated in Figure 4 are not isolated but reflect a recurring pattern captured by the proposed evaluation framework.
Discussion and Conclusions
This study proposed a demand-informed methodology for evaluating intermodal redundancy in public transportation systems and demonstrated its applicability through a case study of Seoul. By incorporating operational characteristics, passenger demand, and actual travel behavior, the proposed framework addresses key limitations of conventional geographical redundancy evaluations, which tend to rely solely on spatial overlap. In particular, the use of station-based and trip-based redundancy measures enables redundancy to be interpreted at the level of access points and realized passenger trips, providing a more user-oriented and operationally meaningful assessment.
Applying the proposed method to Seoul’s bus–subway system identified 14 bus lines characterized by high redundancy combined with insufficient demand. These lines represent cases where overlapping services are not effectively utilized, indicating potential inefficiencies in resource allocation. By distinguishing between demand-supported and demand-deficient redundancy, the results offer actionable insights for transit agencies seeking to optimize bus routes while maintaining accessibility. Rather than treating redundancy as inherently problematic, the proposed framework supports more nuanced decision-making by identifying where redundancy reduction may improve operational efficiency without undermining service coverage.
From a policy perspective, the findings suggest that bus network adjustments can play a critical role in improving overall system efficiency in metropolitan areas where subway infrastructure is largely fixed. The proposed method can support both short term operational reviews and long term planning efforts, such as evaluating candidate routes for modification or assessing the potential impacts of new transit services. Because the framework relies on widely available smart card and open data, it can be implemented in practice in cities with comparable data environments, including those operating public transport big data platforms.
Despite these contributions, this study has several limitations that should be acknowledged. First, the analysis focused on redundancy between individual bus lines and nearby subway lines, rather than considering redundancy across the entire subway network or among multiple competing modes simultaneously. Second, the evaluation relied on aggregated passenger demand indicators and did not explicitly account for transfer behavior, travel time differences, or service quality attributes that may influence mode choice. Third, the case study was limited to Seoul and a single observation period, which may restrict the generalizability of the results to other urban contexts or temporal conditions. Future research can address these limitations in several ways. Extending the framework to assess redundancy at the network level would enable a more comprehensive understanding of multimodal interactions. Incorporating transfer usage, travel time, and service reliability could further refine the interpretation of functional redundancy from a user perspective. In addition, applying the methodology to other metropolitan areas or multiple time periods would help evaluate its robustness and transferability across different transit systems and demand conditions.
This study presents a practical and scalable approach for identifying and interpreting redundancy in public transportation networks by integrating spatial overlap with demand-sensitive indicators. By bridging the gap between traditional geometric evaluations and user-based assessments, the proposed framework provides transit agencies with a more reliable basis for improving resource efficiency and supporting data-driven network optimization in complex urban environments.
